
ABS-Based Long-Term Property Projections for Australian Investors
Long term property projections are scenario-based estimates built from official demographic and price data, not guaranteed forecasts of what a property will be worth. They work best when you treat them as structural inputs, drawn from sources like the ABS and AHURI, and run them through low, medium and high cases rather than a single number. The next step is building those scenarios and stress-testing the cash flow behind them, something tools like investment modelling platforms are built to do quickly.
TL;DR:
- Long-term property projections should be built using consistent official data series, with clear assumptions about growth, inflation, and demand.
- Supply responsiveness is limited, making demand-driven factors like migration and employment more influential on prices than supply increases.
- Stress-testing scenarios for interest rate rises, rent shocks, and migration slowdowns reveal potential risks that could significantly impact cash flow.
- Local supply pipeline data, infrastructure projects, and vacancy rates matter more for suburb-level forecasts than national figures alone.
- Relying on a single projection number is risky; instead, analyze ranges from low, medium, and high scenarios to better understand potential outcomes.
Wealthstackerwealthstacker.com.auModel Your Property StrategyWealthStacker combines quarterly valuations, AI tools and personalised modelling to compare rentvesting and buying strategies.Explore WealthStacker
Table of Contents
- What official data actually measures
- What the research says about supply, demand and the macro backdrop
- How to build a 10, 15 or 25-year property projection
- The downside risks your sensitivity cases need to cover
- From projection to decision: cash flow rules that matter
- How WealthStacker applies this workflow in practice
- Why your suburb matters more than the national number
- Where long-term projections fall short
- Using past cycles to sense-check your assumptions
- Run your first projection with WealthStacker
- FAQ
- Sources
What official data actually measures
Before you calculate anything, decide which series you’re using and stick to it. The ABS household and family projections model how many households Australia will need, projecting a rise from 10.0 million households in 2021 to between 13.3 million and 13.9 million by 2046, alongside population growth from 25.7 million to 33.9 million. These are demographic scenarios under stated assumptions, useful for sizing long-run demand, not a price forecast.
Separately, the ABS Residential Property Price Indexes measure price movement in the existing dwelling stock using stratification and value weights, updated roughly every five years. An index tracks relative change in a basket of properties; a median sale price tracks the midpoint of what actually transacted in a period, which shifts with the mix of properties sold. Mixing the two when calculating multi-year growth produces numbers that look precise but mean nothing. Pick one series, understand its methodology, and use it consistently across your whole projection horizon.
What the research says about supply, demand and the macro backdrop
Three bodies shape the structural story behind any projection: AHURI on supply, Treasury on demand, and the RBA on the macro environment.

AHURI’s research on supply responsiveness found that new housing supply reacts only modestly to price rises. That’s a key reason prices in constrained markets don’t correct as fast as basic supply-and-demand intuition suggests.
Treasury’s housing demand projections model dwelling requirements under different migration scenarios, with the medium case implying around 160,000 additional dwellings needed annually between 2008 and 2023, tapering to roughly 155,000 a year from 2023 to 2038. Treasury is explicit that these figures describe demand, not where prices will land; supply responsiveness and finance conditions determine the rest.
The RBA’s published outlooks focus on inflation, interest rates and employment rather than offering long-horizon dwelling-price targets. They’re a useful macro backdrop for setting plausible bounds on your own assumptions, not a substitute for them.
How to build a 10, 15 or 25-year property projection
A workable long-term projection follows the same five steps whether you’re doing it on a spreadsheet or inside a modelling tool.
- Choose one price series and stay consistent. Decide upfront whether you’re working from an index or a local median, and don’t switch midway through your calculation.
- Set your horizon and growth basis. Decide if you’re projecting nominal growth (includes inflation) or real growth (inflation stripped out), and state your inflation assumption explicitly.
- Gather the full set of financial inputs. You’ll need purchase price, deposit, loan term and rate, expected rent, vacancy allowance, ongoing costs, tax position, and transaction and sale costs at the end of the horizon.
- Run the core formula. Future value equals current value multiplied by (1 + growth rate) raised to the power of years. A property worth $600,000 growing at a nominal 4% a year becomes roughly $888,000 after 10 years; run the same formula with an inflation-adjusted rate to see what that’s actually worth in today’s dollars.
- Produce low, medium and high cases. Vary your growth rate, rent growth and interest rate assumptions across three scenarios and read the spread, not just the medium outcome, as your real answer.
The gap between your low and high case tells you more than any single projected figure. A tight spread suggests confidence in the assumptions; a wide one tells you to build more cash-flow buffer before committing. Our guide to forecasting methods walks through this checklist in more depth if you want to apply it to a specific property.
The downside risks your sensitivity cases need to cover
A projection is only as useful as its stress tests. Build at least these variations into your low case:
- Interest rate movement: test a 1% rate rise against your current repayments, informed by the RBA’s published rate outlook.
- Rent shock: model a 10% drop in achievable rent for at least one year.
- Migration slowdown: reduce population growth assumptions to the lower end of the ABS household projection range.
- Supply surprise: assume limited relief from new construction, consistent with AHURI’s finding that supply responds only modestly to price signals.
- Employment disruption: test a vacancy period of two to three months if you or a tenant loses income.
AHURI’s supply elasticity findings matter here because they cap how much comfort you can take from “more homes will get built if prices rise.” That buffer is thinner than most people assume, which is exactly why rate and rent shocks tend to bite harder than supply-side optimism suggests.
Pro tip: Weight your pessimistic case using the worst combination that’s actually happened before, not a worst-case-of-everything scenario that’s never occurred simultaneously.
From projection to decision: cash flow rules that matter
Once you’ve got nominal and real outputs across three scenarios, the next job is turning them into rules you’ll actually follow. Prioritise cash flow under your pessimistic case over capital growth in your medium case: a property that survives a rate rise and a rent shock is worth more to you than one that only works if everything goes right.
Set explicit thresholds before you buy: the maximum rate rise you can absorb without refinancing, the minimum rent growth needed to keep the property cash-flow neutral, and the downside you’re prepared to accept before selling. If your numbers only work in the high case, that’s a sign to either wait, renegotiate, or consider rentvesting instead of owner-occupying, since renting where you live and investing where the numbers work gives you more flexibility to walk away from a single stretched purchase.
How WealthStacker applies this workflow in practice
Running the workflow above by hand is doable, but keeping it current every quarter is where most investors drop off. We built our platform around that gap.
- Automated quarterly valuations keep your base price series current without you re-pulling data every few months.
- Modelling for rentvesting and buying lets you run multiple growth, rent and interest-rate scenarios side by side instead of building them from scratch each time.
- Path planning projects your net worth across a chosen horizon so the low, medium and high cases translate directly into a wealth trajectory you can act on.
If you’ve already got a purchase price, loan details and a rent estimate in mind, those three inputs are enough to get a first scenario running.
Why your suburb matters more than the national number
National projections set the ceiling and floor for what’s plausible, but they say nothing about why one suburb outperforms the one next to it. Local supply pipeline data, such as development approvals and construction completions tracked at the council or SA2 level, tells you whether new stock is actually coming that could cap growth in a specific pocket. Employment access, meaning how many jobs are within a reasonable commute, tends to support demand even when broader migration assumptions soften.
Infrastructure timing is another local factor that national series can’t capture: a new rail line, hospital or school catchment change can shift demand well ahead of population growth catching up. Zoning changes work the same way in reverse, opening up higher-density approvals that increase effective supply faster than historical patterns suggest.
The practical approach is to treat your national or capital-city projection as the macro envelope, then layer in local vacancy rates, recent sale evidence, and approval data for the specific suburb or even street. Our piece on supply and demand dynamics covers how these local and national forces interact, and local buyers agents often have a feel for pipeline supply well before it shows up in official statistics, which is worth factoring into your assumptions even if it can’t be the primary data source.

Where long-term projections fall short
The biggest pitfall is treating a single projected number as a target rather than a midpoint of a range. Every projection depends on assumptions about migration, interest rates and supply that can shift materially over a 15 or 25-year horizon, and a model built in one rate environment can look very different five years later.
A second common mistake is mixing data series mid-calculation, using a median sale price for your starting value and an index growth rate to project forward, which compounds a methodological mismatch over time. A third is ignoring revision timing: recent quarters in official indexes get revised as more sales data arrives, so the most recent data point in any series is often the least reliable.
Smaller markets carry their own trap. Low observation counts in smaller capitals or regional areas can produce noisy quarter-to-quarter movements that look like trends but aren’t, so a single strong or weak quarter shouldn’t shift your long-term assumptions much. Finally, projections that ignore holding costs, vacancy periods and transaction costs at sale tend to overstate the net outcome substantially; the gross growth number and the number that actually lands in your pocket after tax, fees and vacancy are rarely close.
Using past cycles to sense-check your assumptions
History doesn’t repeat exactly, but Australian property has moved through recognisable cycles of rate tightening, flat or falling prices, then recovery as rates ease and migration picks up again. Looking at how long previous downturns lasted and how sharp the subsequent recovery was gives you a sanity check on whether your low case is actually pessimistic enough.
The useful exercise isn’t predicting the next cycle’s timing, which nobody can do reliably, but testing whether your medium case assumes conditions similar to the best years of the last cycle rather than an average across the full cycle. If your 15-year projection only works because you’ve assumed the strongest five years repeat throughout, that’s a sign to widen your scenario range rather than narrow it.
Interest rate cycles matter most here because they move faster than demographic trends and have historically had the largest short-term effect on borrowing capacity and therefore price. Anchoring your rate assumptions to a realistic range drawn from the last two decades, rather than the most recent quarter, tends to produce a more defensible medium case.
Run your first projection with WealthStacker
Before you start, have three things ready: a current property value or purchase price, your loan details including rate and term, and a realistic rent estimate for the property or suburb you’re considering.
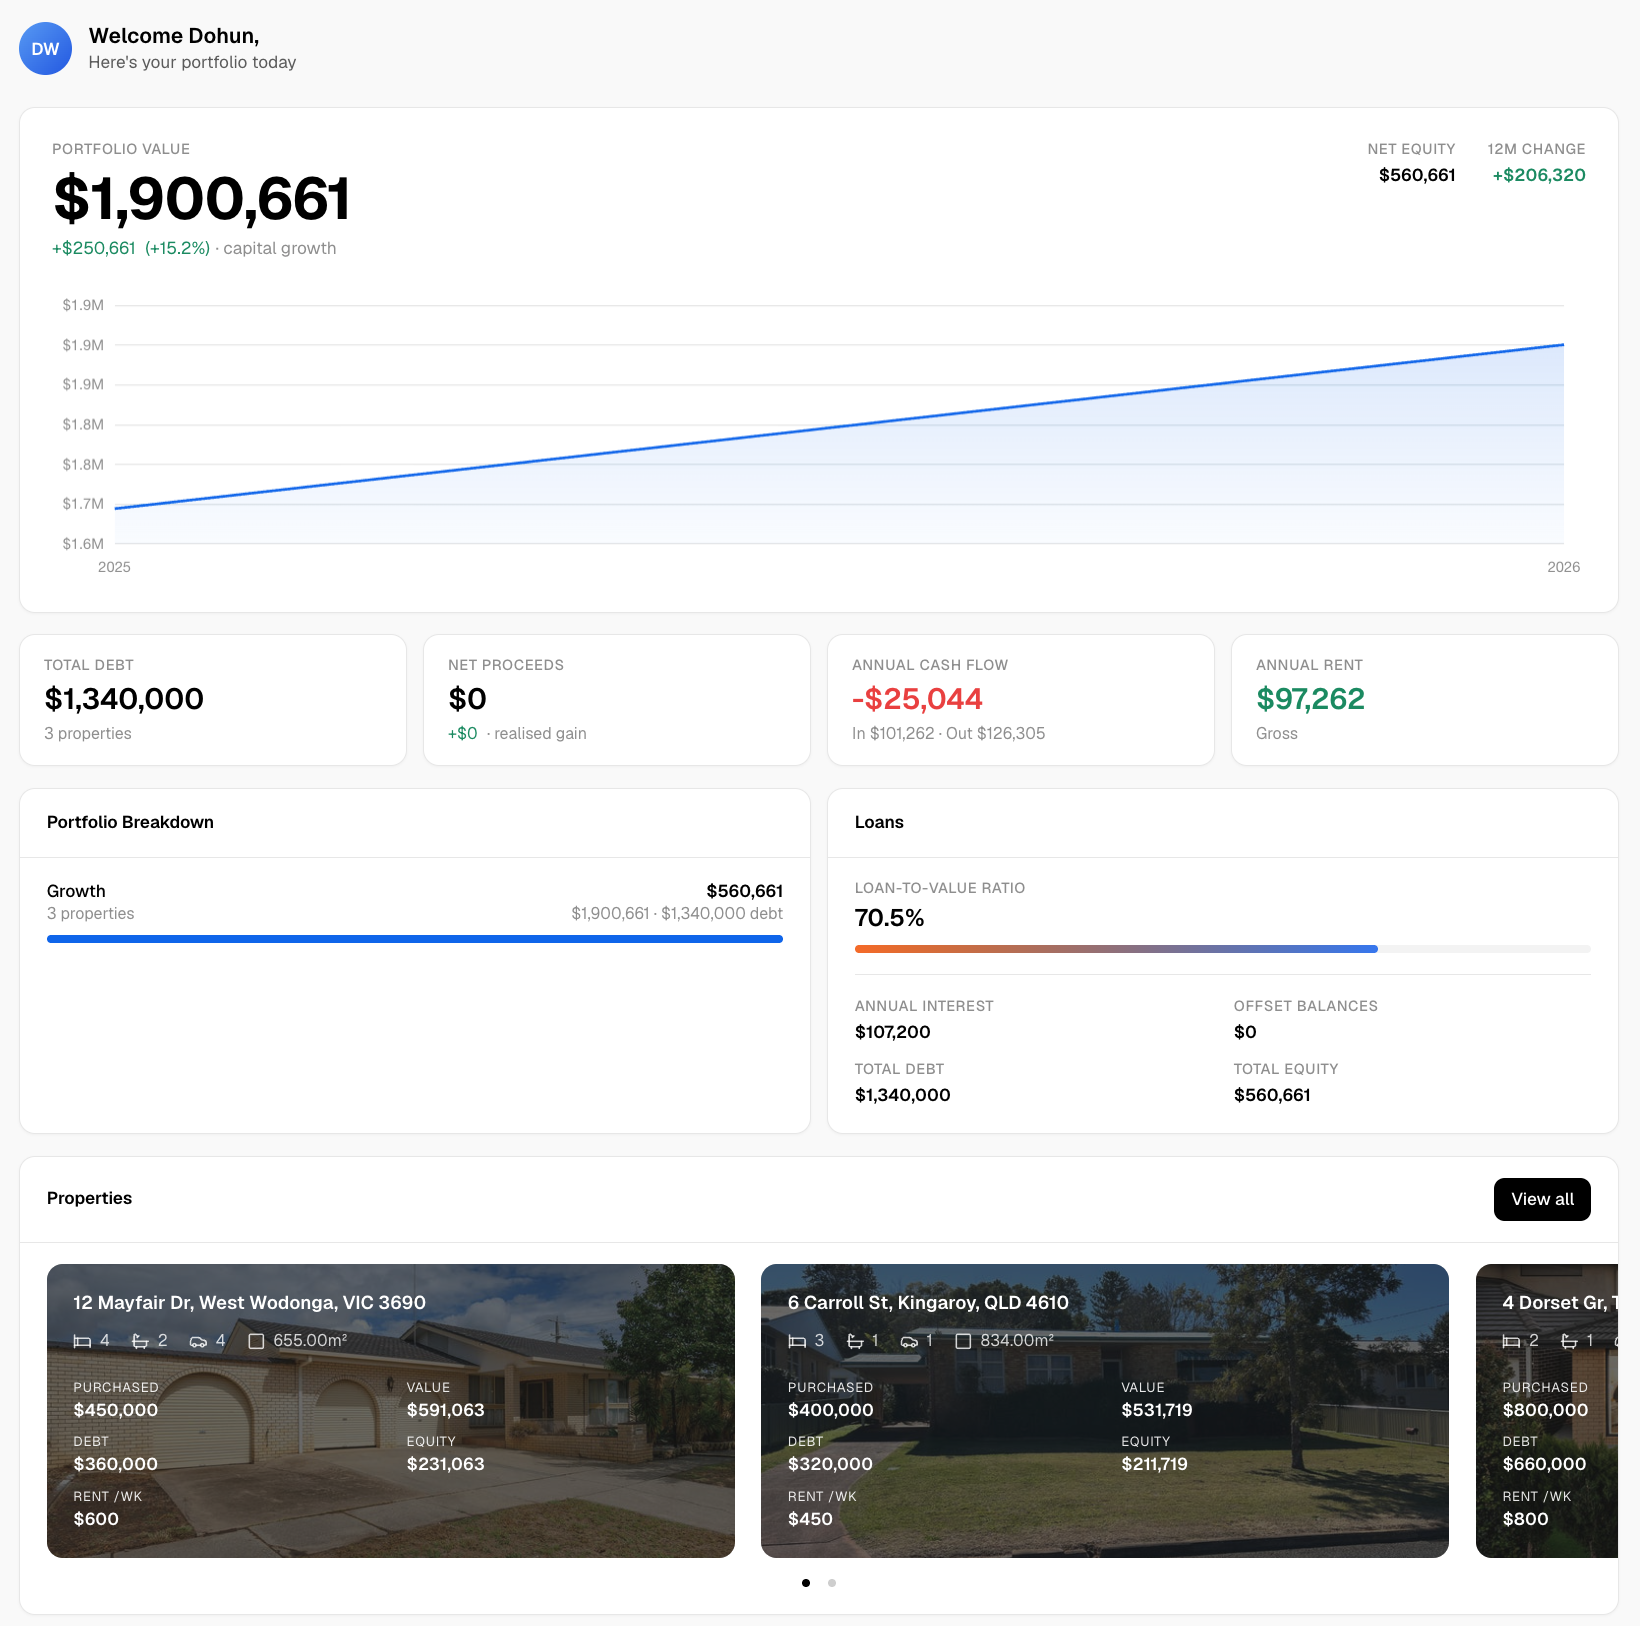
With those inputs, our quarterly valuations and modelling tool let you build low, medium and high growth scenarios for buying or rentvesting without touching a spreadsheet. Head to WealthStacker to run your first scenario and see what your numbers look like under pressure, not just under the best case.
FAQ
Will property prices double in 10 years?
Whether prices double depends entirely on the growth rate you assume and the starting series you use, since there’s no single official forecast guaranteeing that outcome.
What will my house be worth in 10 years?
Your property’s future value depends on the growth rate, horizon and series you apply to its current value, calculated as current value multiplied by (1 + growth rate) raised to the power of years. Running low, medium and high growth assumptions gives you a realistic range rather than a single number, and tools like WealthStacker can generate that range from your current valuation.
Is there a prediction for a major property price downturn in 2027?
There’s no official forecast from the RBA, Treasury or ABS predicting a specific downturn date. Rate rises, migration slowdowns or employment shocks could each pressure prices in a given year, which is why building a pessimistic sensitivity case into your projection matters more than trying to time a single event.
What will houses be worth in 2030?
No official national source publishes a precise dwelling-price target for 2030, since the RBA’s published outlooks extend to around 2028 and focus on macro variables rather than price levels. A credible 2030 estimate requires you to state your own current value, growth assumption and horizon, then run nominal and inflation-adjusted versions side by side as low, medium and high cases.
How do I use official data to build my own projection?
Start with a consistent price series from the ABS Residential Property Price Index, apply a stated growth assumption using the compounding formula, and layer in demographic context from ABS household projections. Running the same calculation across low, medium and high growth cases, as a tool like WealthStacker does automatically, gives a more honest picture than a single projected figure.
Sources
ABS and the Residential Property Price Index cover the national and capital-city picture, but a sharper projection draws on a wider set of inputs. Local council development application data shows what’s actually approved and likely to be built, which matters more for suburb-level forecasting than any national supply figure.
Rental vacancy rate data, published periodically by state-level bodies and some real estate institutes, gives you a leading indicator for rent growth before it shows up in lease renewal data. Employment and income growth figures at the regional level help explain why some areas sustain higher price growth than their demographic projections alone would suggest.
Cash-flow modelling guides, such as practical cash-flow calculation frameworks, are useful for making sure your holding-cost assumptions are complete rather than optimistic. Local buyers agent commentary, while not a data source in the statistical sense, often flags pipeline supply and demand shifts in specific suburbs before they appear in quarterly official releases, which is worth cross-checking against the local market insights agents publish.
- Household and Family Projections, Australia, 2021-2046 | ABS
- Housing supply responsiveness in Australia: distribution, drivers and institutional settings | AHURI
- Projections of housing demand in Australia 2008–2038 | Treasury