
Automated Valuation Accuracy: When Australian Investors Need a Valuer
Automated valuation models in Australia can vary in accuracy by suburb, data quality and the algorithm behind the estimate. Australian research measures this using RMSE and MAPE, and the Automated Valuation Models literature treats such figures as workable for mass appraisal, not for formal or legal use. Tools like WealthStacker fit well here as a way to track estimates over time.
TL;DR:
- Australian comparisons found XGBoost had relatively low MAPE in Melbourne, while Random Forest performed well in Sydney, so no algorithm leads everywhere.
- A Brisbane study of 34,399 sales from 2018 to 2020 found image fusion cut RMSE by about 28.35% in some experiments, not universally.
- Estimates become less dependable when sales are sparse, markets shift quickly, renovations are unrecorded, or properties differ from typical homes.
- Before relying on an estimate, compare it with recent local sales and check its error range; use a registered valuer for lending, SMSF, or legal matters.
WealthstackerTrack Property Values Over TimeWealthStacker provides automated quarterly valuations and investment insights to help Australian investors follow property estimates as markets change.Explore WealthStacker
Table of Contents
- How AVMs work: models, data inputs and what ‘mass appraisal’ means
- What Australian research measures: study results and accuracy metrics
- Factors that materially affect AVM reliability in Australia
- AVMs versus professional valuer reports: what each is acceptable for in Australia
- How to check and use an automated estimate when buying or investing in Australia
- WealthStacker: a practical Australian tool for frequent automated valuations and portfolio insight
- FAQ
- Sources
How AVMs work: models, data inputs and what ‘mass appraisal’ means
An automated valuation model estimates a property’s worth by running data through a statistical or machine-learning model trained on thousands of past sales. Instead of a person inspecting a property, the model finds patterns between known sale prices and property characteristics, then applies those patterns to the subject property.
Three broad approaches sit behind most Australian AVMs. Hedonic price models, the oldest type, treat a sale price as the sum of separately priced features: an extra bedroom adds a certain amount, proximity to the coast adds another, and so on. Machine-learning models such as Random Forest and XGBoost go further, letting the algorithm detect non-linear relationships and interactions between features that a hedonic model would miss, for instance how land size matters more in outer suburbs than in inner-city unit markets. The newest category, fusion models, adds visual data such as aerial and street-view imagery to the numerical inputs, letting the model pick up on cues like roof condition, greenery or street appeal that spreadsheets alone can’t capture.
The data feeding these models usually includes:
- Recent comparable sales in the same suburb or postcode, weighted by how similar they are to the subject property.
- Core structural details: bedrooms, bathrooms, car spaces, land size and dwelling type.
- Location variables such as distance to the coast, schools, transport and the central business district.
- Market-level indicators including recent price trends and days on market for the local area.
- In newer fusion models, aerial and street-view imagery that captures condition and presentation.
This design is what makes AVMs useful at scale. A registered valuer can assess a limited number of properties, while an AVM can revalue a city’s housing stock at scale, which is why banks, governments and research institutions use them for mass appraisal. The trade-off, as the AVM property market perspective from industry researchers points out, is that this scale comes at the cost of nuance. A model trained on typical homes has little to work with when it meets a heritage-listed cottage, a rural acreage block or an architecturally unusual build, and its accuracy may drop for those properties.
For readers who want a deeper walkthrough of the mechanics, our explainer on automated property valuation models covers the investor-facing basics in more detail.
What Australian research measures: study results and accuracy metrics
Two accuracy metrics dominate Australian AVM research, and understanding them makes the published results far easier to interpret.
Mean Absolute Percentage Error (MAPE) expresses the average size of a model’s error as a percentage of the actual sale price. A MAPE of 10% means the model’s estimates are, on average, 10% away from what properties actually sold for. Root Mean Square Error (RMSE) measures error in dollar terms but penalises large misses more heavily than small ones, which makes it useful for spotting models that get wildly wrong on a subset of properties even if their average looks fine.
A comparative study of Greater Sydney and Melbourne housing markets tested statistical and machine-learning models against each other and found that accuracy varies meaningfully by both algorithm and city. In the Melbourne dataset, XGBoost models achieved relatively low MAPE, while a separate Sydney-focused analysis within the same comparison found Random Forest models could achieve comparatively low MAPE. Neither algorithm won outright across both cities, which tells us something important: the best-performing model is largely dependent on local market structure and data patterns rather than being a fixed property of the algorithm itself.
Fusion models that add imagery to the mix have shown some of the largest accuracy gains reported in Australian research. A QUT case study using image-data fusion models on 34,399 Brisbane sales between 2018 and 2020 found that preferred fusion models reduced RMSE by around 28.35% in some experiments compared with models using sales data alone.
A related Brisbane-based study built convolutional neural network models that tested aerial and street-view imagery using sales data. It found:
- Aerial imagery reduced prediction RMSE in the study’s experiments.
- Street-view imagery also improved prediction accuracy in the study.
- Combining imagery types with traditional sales data consistently outperformed models using sales data in isolation.
These are meaningful gains, but they come from experimental research rather than being universal guarantees for every commercial AVM on the market. Most AVMs operating in Australia today still rely primarily on sales and property attribute data, with imagery-fusion techniques representing the leading edge of what’s technically achievable rather than the industry standard.
On acceptable error thresholds, the Automated Valuation Models perspective from industry researchers frames AVMs as mass appraisal tools: useful for speed, cost and consistency across large portfolios, but with predictive power that degrades for individual, non-standard assets where a valuer’s judgement still matters.
For more on how machine learning and imagery techniques are developing in this space, see our guide to the role of AI tools in property valuation.
Factors that materially affect AVM reliability in Australia
Not every AVM estimate deserves the same level of trust. Several factors push accuracy up or down for a given property, and knowing them helps you judge whether a figure in front of you is solid or shaky.
Data quality and recency sit at the top of the list. The AI and automated valuation literature notes that AVM reliability is heavily constrained by the quality of the data feeding it: inconsistent address formatting, missing renovation records and lags between a sale occurring and that sale appearing in the dataset all introduce noise that an algorithm can’t resolve on its own. If you’ve just finished a major renovation that hasn’t been recorded anywhere official, the model is working from outdated information about your property and its estimate will reflect the old version of the home.
Property type and market turnover matter just as much:
- Low-turnover suburbs with few recent sales give the model less to learn from and may widen the likely error band.
- Unique or non-standard properties, such as acreage blocks, heritage homes or architect-designed builds, may not fit the patterns learned from typical sales and can be harder to estimate.
- Properties in rapidly changing markets may be valued against sales data that no longer reflects current conditions.
- Units and townhouses in homogeneous developments may be easier to estimate when comparable sales are available within the same building or estate.
Model coverage is a less visible but equally important factor. An AVM trained primarily on capital city data may perform noticeably worse in a regional town or an outer-suburban growth corridor where sales volumes are lower and property types more varied. Spatial segmentation, where a model is effectively retrained or recalibrated for different geographic zones, helps address this, but not every AVM applies it with the same rigour.
The Brisbane imagery research referenced earlier found that adding aerial and street-view imagery reduced prediction error in its experiments, but this benefit isn’t universal. Imagery tends to help most where visual condition and street appeal genuinely differ between otherwise similar properties, such as a renovated versus an original 1960s brick home on the same street. It helps less in markets where properties are already highly standardised, like a modern apartment tower, since there’s less visual variation for the model to learn from.

Pro Tip: Check whether the AVM you’re using states which suburbs or property types it was trained on. A model silent on this is harder to trust for anything outside typical capital city housing.
AVMs versus professional valuer reports: what each is acceptable for in Australia
An automated estimate and a signed valuation report are not interchangeable, and the distinction matters most when you need the figure for anything beyond your own research.
An AVM output carries no professional signature, no indemnity insurance and no accountability if the figure turns out to be wrong. A registered valuer’s report does, which is exactly why it’s required wherever money or legal standing is on the line. In practice, this means AVMs are generally not accepted for lender valuation panels, SMSF compliance audits or legal and court matters, even where the AVM’s underlying accuracy might be perfectly reasonable for everyday purposes.
Formal occasions that require a registered valuer (through bodies such as the Australian Property Institute or the Australian Valuers Institute) typically include:
- Mortgage applications, where lenders generally require a valuation from their approved panel.
- Self-managed super fund compliance, where auditors expect an independent, qualified valuation for property held within the fund.
- Legal proceedings such as family law settlements, deceased estates or disputes over property value.
- Insurance claims involving total loss or major damage, where a formal valuation supports the payout.
AVMs earn their keep in a different set of situations: early-stage research when you’re comparing suburbs or scanning for opportunities, ongoing portfolio tracking across properties you already own, and quick sanity checks before you decide whether a deeper, formal valuation is worth commissioning. A growing middle ground has also emerged in the Australian market: hybrid services that pair an AI-generated assessment with review by a registered valuer, offering more rigour than a pure AVM without the full cost and turnaround of a traditional in-person valuation.
How to check and use an automated estimate when buying or investing in Australia
Treating an AVM figure as a starting point rather than a final answer protects you from decisions built on a number that’s less solid than it looks. Four checks, done in sequence, cover most of what matters.
- Check the stated confidence interval or error band. Some AVMs publish a range alongside their point estimate; compare it with the available research and consider how property type and local sales activity may affect reliability.
- Review recent comparable sales in the same suburb. Look at properties similar in size, condition and land area, and see whether the AVM estimate sits comfortably within that range or stands out as an outlier.
- Check for condition or renovation details the model might have missed. A quick look at recent listing photos, council records or your own knowledge of the property can reveal upgrades or issues the dataset hasn’t caught up with yet.
- Commission a registered valuer when the stakes call for it. If the gap between your own research and the AVM estimate is larger than the expected error range, or if you need the figure for a lender, SMSF or legal purpose, a formal valuation is the only acceptable next step.
Pro Tip: Run the same property through more than one AVM where possible. A tight cluster of estimates gives you more confidence than a single number in isolation.
Used this way, an AVM becomes a monitoring and scenario-planning tool rather than a substitute for professional judgement. It’s well suited to tracking how your portfolio’s value shifts quarter to quarter, stress-testing a potential purchase before you commit to due diligence costs, or comparing how different suburbs are trending, but it shouldn’t be the sole evidence behind a lending decision or a legal position. Our guide on using AI valuation tools for portfolio tracking walks through this monitoring approach in more depth.
WealthStacker: a practical Australian tool for frequent automated valuations and portfolio insight
Once you understand what an AVM can and can’t do, the practical question becomes how to get one that updates regularly, fits an Australian context and feeds into actual investment decisions rather than sitting as an isolated number. WealthStacker is designed to help address that gap.
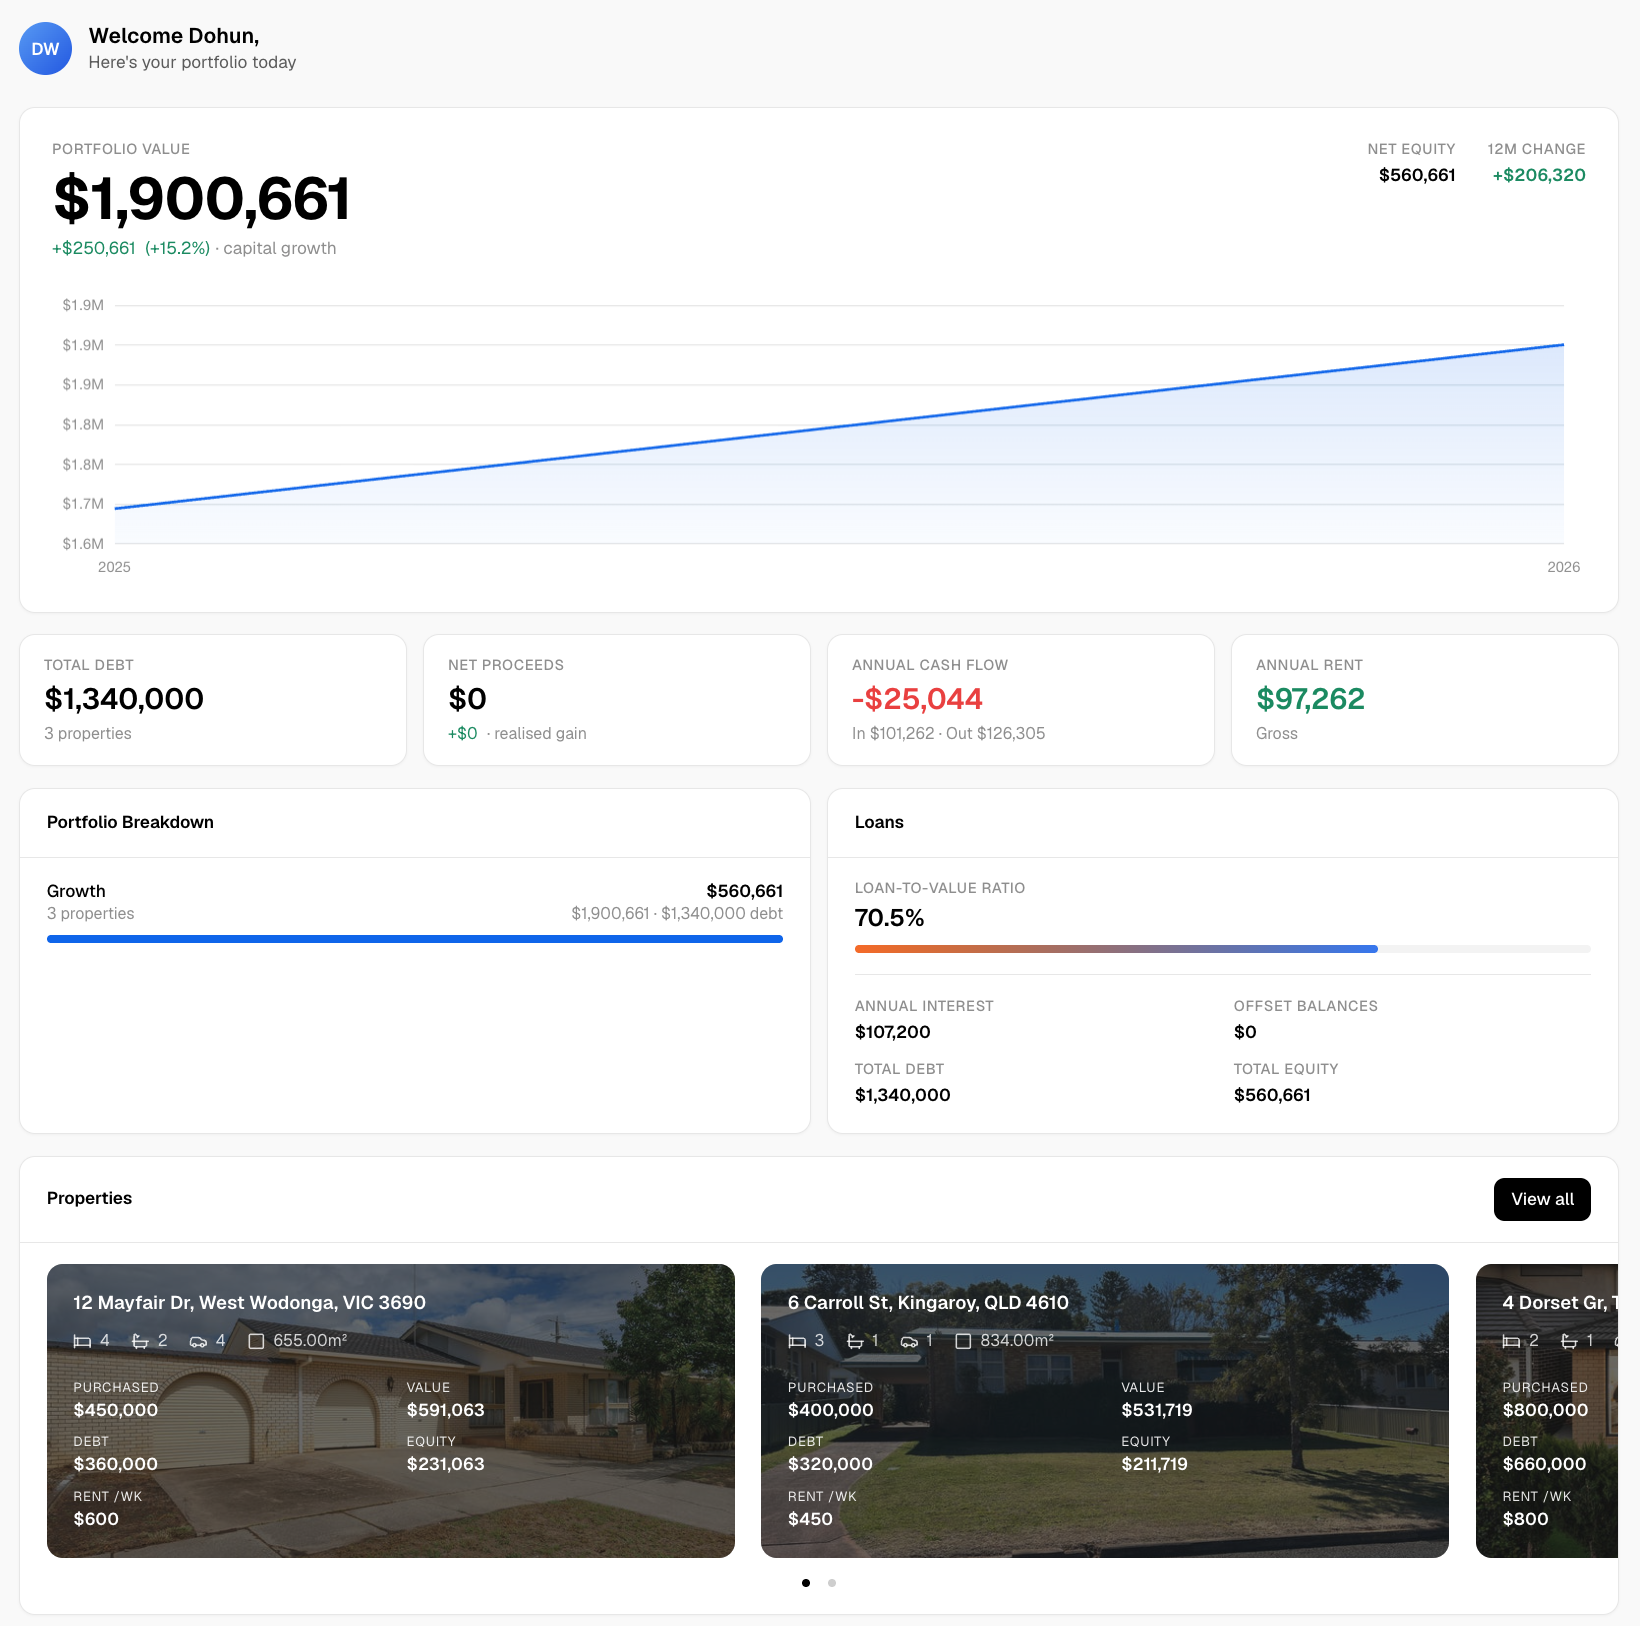
Our toolkit gives you:
- Automated property valuations to help you track your portfolio.
- Scenario modelling that compares rentvesting against buying.
- Portfolio dashboards for your investments.
- Borrowing power estimations to help you gauge what’s realistic before you start searching.
These tools sit squarely in the monitoring and scenario-planning role described throughout this article. We’re not a substitute for a registered valuer’s signed report when a lender, an SMSF auditor or a court requires one, and we’d never suggest otherwise. What we do offer is a way to keep your numbers current between those formal moments, test different investment paths before committing money, and understand your position without wrestling with spreadsheets. If frequent, automated valuations and investment modelling sound useful for where you’re at, you can explore WealthStacker and see how the toolkit fits your own numbers.
FAQ
How accurate is AVM in real estate?
Australian studies report AVM accuracy varying by algorithm, location and property type, with error bands commonly discussed as workable for mass appraisal, according to the Automated Valuation Models perspective from industry researchers. Accuracy improves with better data and can tighten further when models incorporate imagery, but it remains less reliable for unique or low-turnover properties.
What is the most accurate property valuation site?
No single automated valuation tool is proven universally most accurate, since comparative Australian research shows different algorithms perform best in different cities and suburbs. The most useful approach is cross-checking an estimate against recent comparable sales rather than relying on any one platform’s figure alone.
What is the most accurate property valuation?
A signed report from a registered valuer remains the most reliable valuation available in Australia, since it carries professional accountability and accounts for details an automated model can miss. Automated estimates are useful for frequent monitoring and comparison but aren’t designed to replace that level of individual assessment.
How accurate is CoreLogic valuation?
Specific accuracy figures for individual commercial providers like CoreLogic aren’t publicly listed as a verified statistic in the Australian academic research reviewed here. As with any AVM, the general principle holds: accuracy tends to be stronger in well-covered suburbs with frequent sales and weaker for unique or low-turnover properties.
Sources
- Big Visual Data Analysis using Artificial Intelligence for Mass Valuation of Residential Properties in Australia
- Geographical variations in AVM accuracy: comparing statistical and machine learning models in Greater Sydney | Journal of Housing and the Built Environment | Springer Nature Link
- Automated Valuation Models: A property market perspective
- Unlocking visual data to enhance the accuracy of AI-enabled mass valuation of urban houses: An Australian city case study | QUT ePrints