
800 Metres Won’t Prove Walkability Adds Value for Australian Investors
Walkability is generally linked to higher property prices, but the size of any premium depends on location, property type and the quality of the walking route. Peer-reviewed hedonic pricing studies and Reserve Bank of Australia analysis both point that way. Here we summarise the evidence, show how walkability is measured, and explain how to test it in your own investment modelling.
TL;DR:
- The 2022 Melbourne study linked destination access with higher house prices, but found a weaker association in the most disadvantaged neighborhoods.
- Sydney evidence found WalkScore related to detached house prices, not unit prices; results also shift with the city, model, and walkability measure.
- Check the resident’s actual route, not straight line proximity: count daily needs within 800 meters and inspect footpaths, crossings, traffic, safety, and service frequency.
- Do not apply a universal price uplift; compare like properties within each suburb, separate CBD effects, and test rent and value under three scenarios.
WealthstackerModel Your Property Investment AssumptionsWealthStacker combines automated quarterly valuations and personalised property modelling to help you assess investment strategies and potential net worth.Explore WealthStacker
Table of Contents
- What walkability means and how Australian measures capture it
- What the evidence shows on walkability and house prices
- Where walkability premiums are strongest
- Practical checklist: assess walkability in person and in data
- How investors should reflect walkability in valuation and modelling
- Test your walkability assumptions with WealthStacker
- FAQ
- Sources
What walkability means and how Australian measures capture it
Walkability is not one score. The Australian Urban Observatory explains it as a functioning local ecosystem: destinations give people something to walk to, connected streets create routes, and enough dwelling density supports shops and services.
In practice, analysts look at three things:
- Land-use mix and destinations: how many daily needs (shops, schools, health services, parks) sit within reach.
- Street connectivity: how directly the street network lets you get from your door to those destinations.
- Dwelling density: whether enough people live nearby to keep local services viable.
Plan Melbourne’s 20-minute neighbourhoods use a catchment of around 800 metres, or a 20-minute return walk.
Measurement detail matters for valuation. A nearby shop in a straight line may be a poor asset if the walk involves a fast road with no crossing. Transport for NSW identifies connected footpaths, crossings, traffic speed, safety and street amenity as the factors that decide whether proximity becomes real walking.

What the evidence shows on walkability and house prices
The clearest Australian evidence comes from a 2022 Melbourne suburb-level study. It found walkability positively associated with house prices, with access to destinations linked to higher prices and poor transit access linked to lower prices. The association was weakest in the most disadvantaged neighbourhoods.
Walkability was positively associated with Melbourne house prices, but the link was weakest in the most disadvantaged neighbourhoods. One uplift figure does not travel across suburbs.
Reserve Bank of Australia research shows why location effects need unpicking. Using 2010 Sydney data, average land value within 4 kilometres of the CBD was around 16 times the average in suburbs at least 50 kilometres away. That gap bundles jobs, transport, waterfront and zoning, so it should not be credited to walking alone.
Other academic work adds a property-type twist:
- WalkScore was positively related to detached-house prices in Sydney, but not to unit prices.
- Measured effects shift with the model, the city and the walkability metric used.
- Proximity to the CBD often soaks up benefits that walkability scores also capture.
Treat published results as evidence of direction, not a number to paste into a spreadsheet.
Where walkability premiums are strongest
Walkability appears to matter most where buyers can actually choose it and pay for it. Some Australian findings suggest detached houses capture more of a premium than units, possibly because units in many areas already sit close to services, so walkability separates them less.
Context changes the picture further:
- Disadvantaged areas: the Melbourne study found weaker price associations, so a walkable street does not automatically translate into a price lift.
- Outer suburbs: low density and sparse destinations can mean a high-quality network still leads nowhere useful.
- Poor pedestrian networks: missing footpaths, limited crossings, fast traffic and poor amenity make walking difficult, especially for children, older people and people with disability.
- Transport assets: a station can lift value through access, but noise, congestion and design can turn it into a disamenity for nearby homes.
The practical lesson is to test your own market. Compare walkable and car-dependent streets within the same suburb, by property type, rather than applying one percentage uplift across a portfolio. Our guide to supply and demand in Australia’s property market shows how amenity premiums sit inside broader market cycles.
Practical checklist: assess walkability in person and in data
Walk the route before you trust the score. Then check it against data.
- Walk the real route. Look for continuous footpaths, safe crossings, shade and seating, and a direct path. Note traffic speed and lighting, and ask whether an older person or someone with a pram could manage it.
- Count destinations. Tally daily needs within 800 metres, or a 20-minute return walk, and check the Australian Urban Observatory components for the area.
- Check public transport. Look at service frequency, not just whether a stop exists.
- Look at retail health. Vacant shopfronts along the walking route are a warning sign, and retail vacancy trends are worth tracking.
- Hunt for disamenities. Test noise, peak-time congestion, evening safety and parking pressure along the route, at the times you would actually use it.
- Check property upkeep. Maintenance problems affect how a street feels. Pest issues, for example, can shape desirability in newer suburbs, as this guide to ants in Canberra’s new suburbs explains.
- Pair with risk checks. Physical risk sits alongside walkability in due diligence, and our piece on climate risk for Australian properties covers that side.
Pro Tip: Map two routes, the walking route in the listing and the route a resident would really take to the shops and station, and base any valuation adjustment on the second one.
How investors should reflect walkability in valuation and modelling
Start by treating literature results as sensitivity bands, not as inputs. Calibrate them against local comparable sales that control for walkability where you can, and keep location bundles such as CBD proximity separate.
- Model rent, not just capital value. Walkability may show up as lower vacancy or steadier rent growth, so test net yield across different holding periods instead of adding one uplift to the purchase price.
- Use planning signals as scenario inputs. Council walking strategies and 20-minute neighbourhood policies can act as medium-term catalysts. Parramatta’s walking strategy, for example, models benefit-cost returns for improved pedestrian networks.
- Check local economics. Planning reports suggest better walking environments can lift retail rents and sale prices, which can feed back into nearby residential demand.
- Run three scenarios. Use a base case with no uplift, a cautious uplift and an optimistic uplift, and write down the assumptions behind each.
Our explainer on automated property valuation models is useful background for the comparable-sales step.
Test your walkability assumptions with WealthStacker
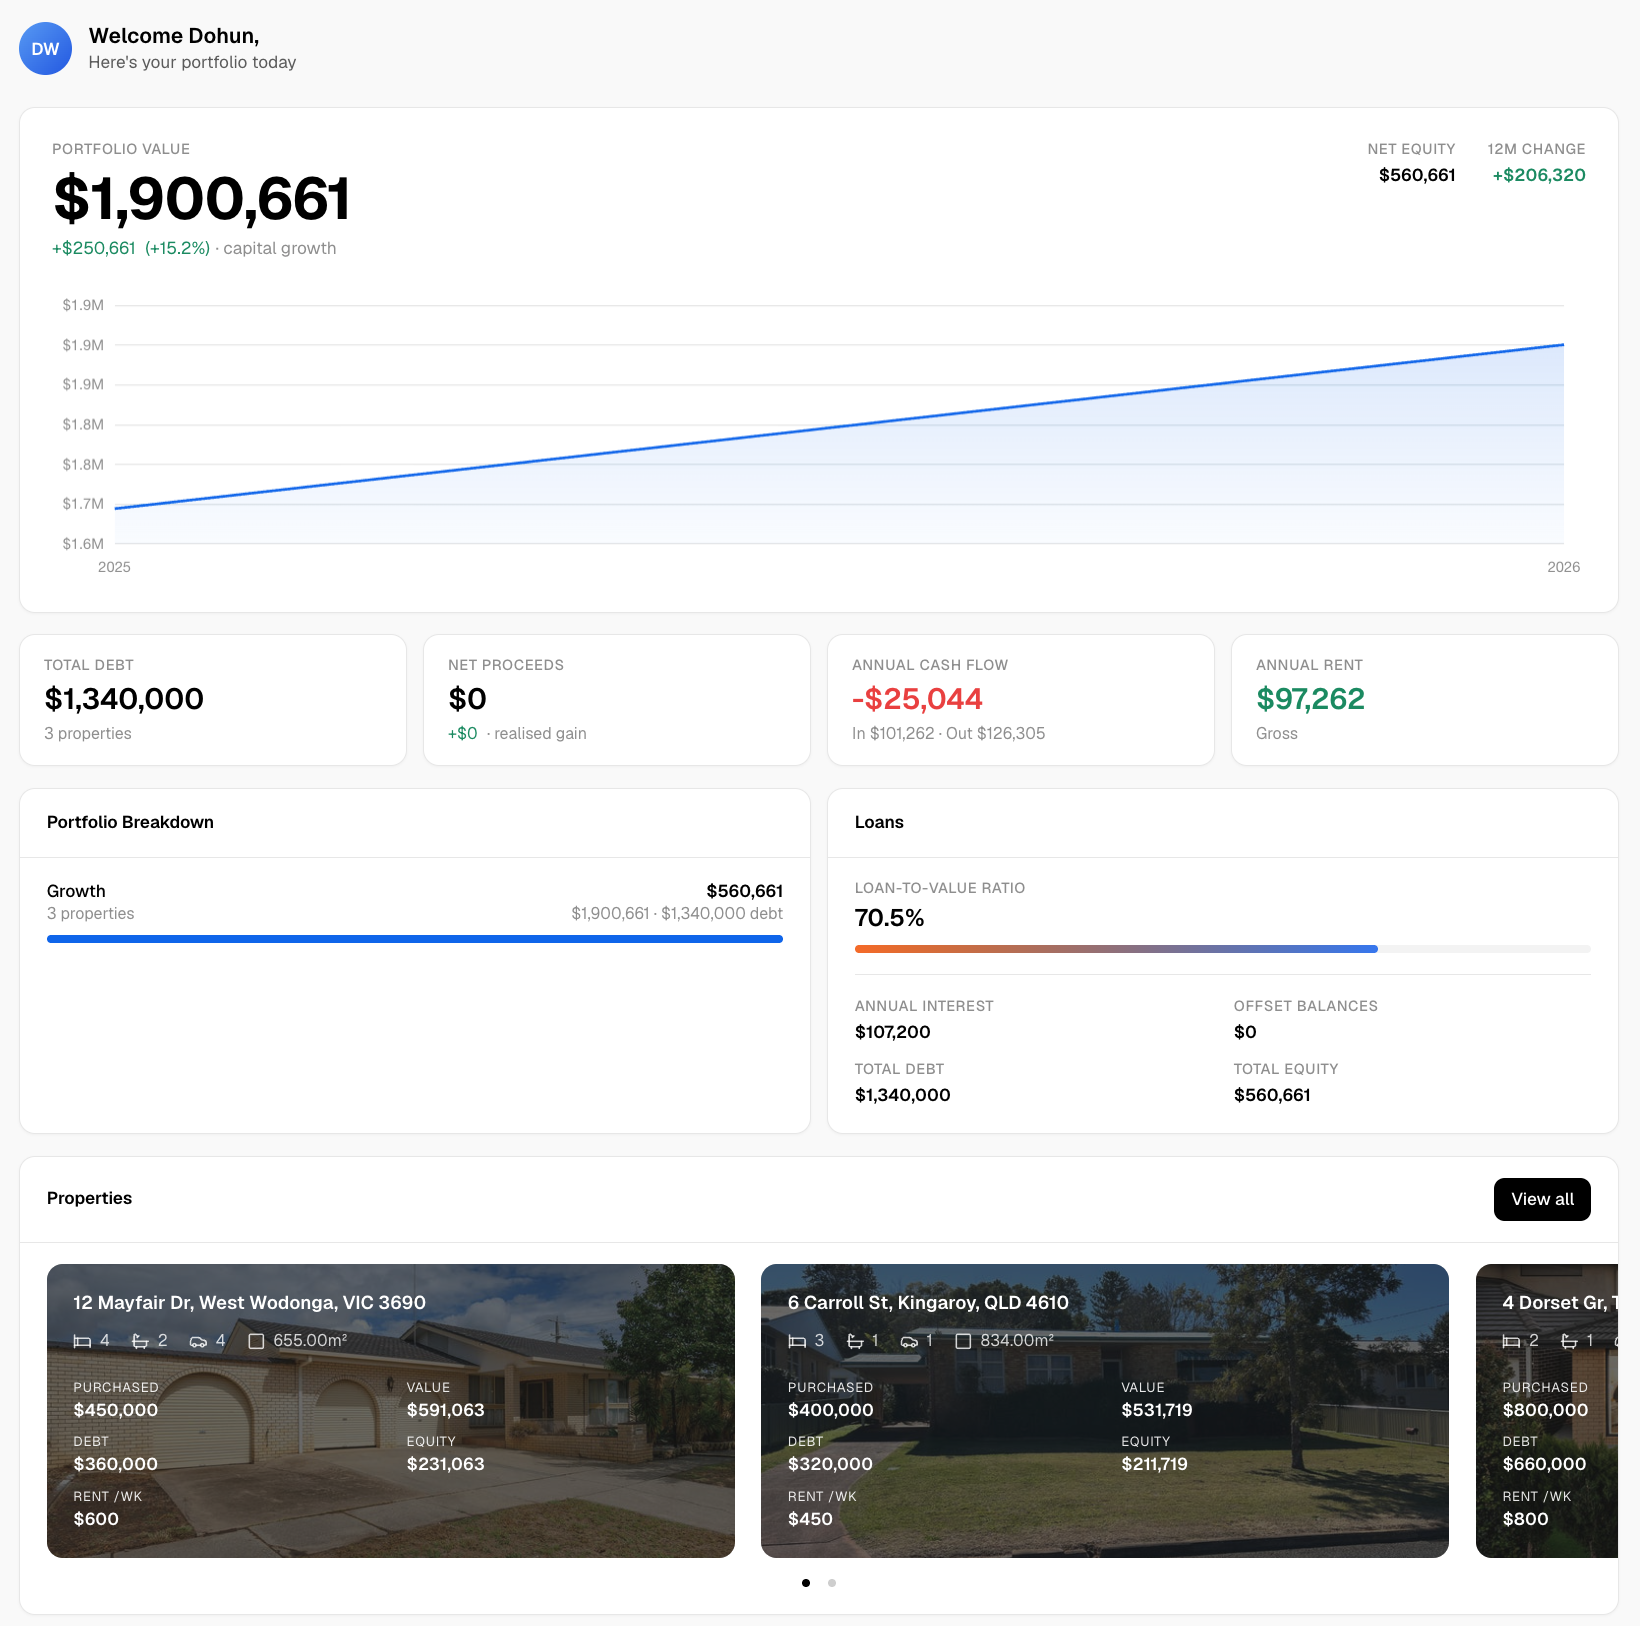
Running “with” and “without” walkability scenarios by hand is slow. We built WealthStacker so you can compare them across a portfolio in one place.
- Free automated quarterly property valuations
- Long-term modelling for rentvesting versus buying
- Suburb-level market research inputs
- AI-assisted scenario testing
Set a base case, then a cautious and an optimistic walkability assumption, and see how each changes your long-term wealth and borrowing power. Sign up here and run your first scenario.
FAQ
What decreases property value the most?
Factors that reduce demand for a location tend to hurt most, such as heavy noise, poor access and hazard exposure. For walkability specifically, unsafe or disconnected routes weaken the benefit of nearby amenities. Always check the local comparable sales before assuming a discount.
What are the downsides of walkable cities?
Walkable areas often cost more, so amenity can become an affordability issue. Melbourne research found weaker price associations in disadvantaged areas, so benefits are not shared evenly. Busy centres can also bring noise and parking pressure.
What is the hardest month to sell a house in Australia?
Our sources do not cover seasonal selling patterns, so we cannot give a reliable answer. Local agent data for your suburb and property type is a better guide than a national rule of thumb.
Which suburbs in Melbourne are the most walkable?
The Australian Urban Observatory publishes walkability analysis for Melbourne that you can use to compare suburbs. Combine any ranking with an on-foot check of the actual routes.