
What is a wealth projection model? Your planning guide
TL;DR:
- A wealth projection model forecasts future net worth and retirement income based on current finances and assumptions.
- It helps identify funding gaps and assess if your retirement goals are on track through scenario analysis.
A wealth projection model is a scenario-based forecast that estimates your future net worth and retirement outcomes by running your current finances forward through time using a defined set of assumptions. Think of it as a financial flight simulator: you set the controls (income, savings rate, return expectations, retirement age), and the model shows where you land.
TL;DR: A wealth projection model tells you three things: whether your net worth is on track, whether your retirement income will be adequate, and where the funding gaps are. It does this by combining your real financial data with explicit assumptions about growth, inflation, and spending, then projecting those forward across a chosen time horizon.
The main elements at a glance:
- Inputs: current assets, liabilities, income, expenses, super balances, property values, contributions
- Assumptions: investment return rates, inflation, tax, fees, retirement age, life expectancy
- Outputs: projected net worth timeline, cash-flow table, income adequacy chart, Age Pension eligibility estimate
Table of Contents
- What does a wealth projection model actually model?
- How does scenario-based forecasting work?
- What are the common pitfalls and limits of wealth projection models?
- What Australian-specific rules must your model include?
- How do you pick a modelling tool in Australia?
- When is a model enough, and when do you need a financial adviser?
- Key takeaways
- Wealthstacker gives you a live model, not a static snapshot
- Useful sources for further reading
What does a wealth projection model actually model?
The quality of any financial projection model lives or dies on its inputs. Feed it stale or incomplete data and the outputs are fiction, regardless of how sophisticated the maths underneath.
Core inputs typically include:
- Asset balances: superannuation, investment accounts, property equity, cash
- Liabilities: mortgage balances, personal loans, margin debt
- Income: salary, rental income, dividends, business distributions
- Expenses: living costs, loan repayments, insurance premiums
- Contribution rates: employer SG, voluntary concessional and non-concessional contributions
- Tax rates and fee structures applicable to each asset class
Key assumptions are where most models diverge. The big ones are nominal or real investment return rates (often split by asset class), the inflation rate applied to expenses, the sequence in which returns arrive (sequence-of-returns risk), and the assumed retirement age and life expectancy. A model that buries these assumptions in a footnote is one you should not trust.
Typical outputs from a well-built model include:
| Output | What it shows |
|---|---|
| Projected net worth timeline | Year-by-year total wealth across the projection horizon |
| Cash-flow table | Annual income vs. expenditure, showing surpluses and deficits |
| Income adequacy chart | Whether projected income meets target spending in retirement |
| Age Pension eligibility estimate | When and how much Age Pension you may receive under means testing |
| Funding gap analysis | The shortfall (or surplus) between projected and required retirement capital |
A practical note on data quality: date-stamp every input when you enter it. Property values shift quarterly, super balances update with each statement, and interest rates move. Keeping your retirement planning spreadsheet current is not a one-off task; it is a discipline that determines whether your outputs stay meaningful.
Pro Tip: Record the source and date of every assumption you use, not just the number. When you revisit the model in 12 months, you will know exactly what to update and why.
How does scenario-based forecasting work?
Scenario-based forecasting is the practice of running the same model multiple times under different assumption sets to understand the range of possible outcomes, rather than betting everything on a single projection. There are three main methods, and each suits a different purpose.
Deterministic modelling applies fixed rates throughout the projection. You choose a return rate of, say, 7% per annum and hold it constant for 30 years. It is simple to build, easy to explain, and useful for quick what-if comparisons: “What happens if I retire at 60 instead of 65?” The weakness is that it ignores the real-world variability of returns, which means it can look far too smooth and optimistic.
Monte Carlo simulation runs thousands of iterations, each with randomly varied return sequences drawn from a probability distribution. The output is a probability cone: you might see that there is a 78% chance your portfolio lasts to age 90 under your current plan. This is the most realistic method for retirement probability analysis because it captures sequence-of-returns risk, the danger that a market downturn in the first few years of retirement can permanently damage a portfolio even if long-run average returns are fine.
Cohort or population modelling aggregates many individual records into demographic groups and projects them forward together. The Australian Treasury’s RIMGROUP model is the most prominent Australian example: it starts with population cohorts from July 2000 and models superannuation accumulation and retirement incomes across the entire workforce. RIMGROUP is designed for policy analysis rather than personal planning, but the underlying logic, that cohort-level assumptions about Age Pension eligibility and super balances can be modelled at scale, is directly relevant when you want to understand how policy changes might affect your own position.
| Method | Best for | Main strength | Main limit |
|---|---|---|---|
| Deterministic | DIY what-if comparisons | Simple, transparent, fast | Ignores return variability |
| Monte Carlo | Retirement probability analysis | Captures sequence-of-returns risk | Requires good distributional inputs |
| Cohort/population | Policy impact, long-horizon population effects | Realistic demographic aggregation | Not designed for individual plans |
For most individuals doing their own investment growth estimates, a deterministic base case paired with a few manual stress scenarios covers most of the ground. Monte Carlo becomes worth the extra complexity when you are within 10 years of retirement and sequence risk is a real concern.
What are the common pitfalls and limits of wealth projection models?
A model is only as good as its inputs. That is not a cliché; it is the single most important thing to understand about wealth forecasting.
The most common mistakes in DIY projections:
- Overly optimistic return assumptions. Using a 10% nominal return for a balanced portfolio when long-run Australian data suggests something closer to 7–8% gross (before fees and tax) will produce projections that look great and retire badly.
- Ignoring fees. A 1% annual fee difference on a $500,000 portfolio compounds to a material shortfall over 20 years. Most DIY models omit this entirely.
- Missing contingencies. Health costs, home repairs, and family support obligations are real expenses that rarely appear in a base-case model. Build at least one scenario that includes a $50,000 unplanned expense in year five of retirement.
- Single-scenario fixation. Running only the base case and treating it as a prediction is the most dangerous modelling habit. No single projection is a forecast; it is one path among many.
- Stale data. A model built on last year’s property valuation and a super balance from two statements ago is already wrong.
A model that shows you exactly what you want to see is the one that deserves the most scrutiny. If your projection shows a comfortable retirement under every assumption you have chosen, ask yourself whether you have stress-tested it honestly. Sequence-of-returns risk, unexpected health costs, and fee drag are the three factors most likely to turn a “comfortable” projection into a funding gap.
Credibility checklist for any model you use or build:
- Are all assumptions documented and dated?
- Does the model include a sensitivity report showing how outcomes change if returns drop by 2%?
- Has the model been updated within the last 12 months?
- Does it include fees, tax, and inflation in the same projection?
What Australian-specific rules must your model include?
Generic calculators built for other markets will give you wrong answers in Australia. The local rules are specific enough that omitting them can shift a projection by hundreds of thousands of dollars over a 30-year horizon.
Superannuation rules to include:
- The Super Guarantee (SG) rate, currently 11.5% of ordinary time earnings, rising to 12% from 1 July 2025
- Concessional contribution cap ($30,000 per year for most members in 2025–26, including employer contributions)
- Non-concessional contribution cap ($120,000 per year, or up to $360,000 under the bring-forward rule)
- Catch-up concessional contributions for members with a super balance below $500,000
- Tax treatment: concessional contributions taxed at 15% inside super; earnings in accumulation phase taxed at 15%; earnings in pension phase tax-free up to the transfer balance cap
Age Pension means test basics:
- Both an assets test and an income test apply; the harsher result determines your payment rate
- The family home is exempt from the assets test, but investment properties and super balances (once you reach pension age) are not
- Modelling Age Pension eligibility matters because even a partial pension can significantly extend portfolio longevity
Tax treatment differences to model:
- Investment property: rental income taxed at marginal rates; capital gains discount of 50% for assets held more than 12 months
- Dividends: franking credits can reduce or eliminate tax on Australian share income
- Super pension phase: generally tax-free for members under the transfer balance cap
Pro Tip: Keep a short change-log in your model: a simple table listing the rule, the current value, the source, and the date you last checked it. When the Federal Budget changes super caps or Age Pension thresholds, you update the table and the model adjusts automatically.
How do you pick a modelling tool in Australia?
Choosing the right tool comes down to five dimensions: who will use it (DIY or adviser-assisted), what scenario types it supports, how well it covers Australian rules, what it costs, and how transparent it is about its assumptions (without specifying exact capabilities).
Selection checklist:
- Does it model Australian super rules, including SG rates, contribution caps, and pension-phase tax treatment?
- Does it include Age Pension means testing?
- Can you run multiple scenarios (optimistic, central, pessimistic) and compare them side by side?
- Are the underlying assumptions visible and editable?
- How often is the data updated, and does the tool show you when rates were last revised?
- Is there a cost, and does the free tier give you enough to make a real decision?
Wealthstacker is built specifically for Australian investors and covers the scenario-based planning criteria above. Its core features include free automated quarterly property valuations, a 15-year investment modelling tool for comparing rentvesting and buying strategies, interactive goal and net worth planners, borrowing power estimates, and an AI-powered investment chat assistant. The automated valuation model feeds directly into ongoing projections, so your property inputs stay current without manual updates.
For adviser-assisted modelling, financial modelling services from advisory firms produce detailed forecasts of how much you need to fund your lifestyle and retirement, often incorporating more complex tax structures and estate planning than a DIY tool handles. The right choice depends on your situation’s complexity, which the next section addresses.
Steps to get started with Wealthstacker:
- Create a free account and connect your property portfolio for automated quarterly valuations.
- Enter your super balance, income, and target retirement age in the goal planner.
- Run the rentvesting vs. buying comparison to see which path builds more net worth over your chosen horizon.
- Review the 15-year net worth projection and identify your first funding gap or surplus.
When is a model enough, and when do you need a financial adviser?
DIY modelling works well for straightforward situations: a single income, a primary residence, a super account, and a clear retirement target. If your financial picture fits on one page, a well-built model with realistic assumptions will give you most of what you need.
Situations that typically suit DIY modelling:
- Salary income with standard employer SG contributions
- One or two investment properties with straightforward loan structures
- A single super fund in accumulation phase
- A retirement target 10 or more years away
Red flags that suggest you need professional help:
- Multiple investment property loans with cross-collateralisation
- A self-managed super fund (SMSF) with complex investment mandates
- Trust structures or business interests feeding into personal wealth
- Significant health or family care obligations that create uncertain future expenses
- A retirement date within five years, where sequence-of-returns risk is acute
The role of a financial planner in these situations is not just to build a better model; it is to identify the risks and structures that a DIY model will miss entirely.
Questions to ask an adviser about their modelling approach:
- What return and inflation assumptions do you use, and what is the source?
- Do you run Monte Carlo simulations or deterministic projections, and why?
- How often do you update the model, and what triggers a review?
- Does the model include Age Pension means testing and super tax treatment?
- Can I see a sensitivity report showing outcomes under pessimistic assumptions?
Key takeaways
A wealth projection model is most useful when it combines realistic Australian-specific inputs, multiple scenarios, and regular updates, not as a one-off calculation but as an ongoing planning discipline.
| Point | Details |
|---|---|
| Definition | A wealth projection model estimates future net worth and retirement income from current finances and stated assumptions. |
| Three critical inputs | Super balance, investment return assumption, and target retirement age drive most of the outcome variance in any projection. |
| Run multiple scenarios | Always compare an optimistic, central, and pessimistic case; a single projection is not a forecast. |
| Validate regularly | Backtest assumptions, run sensitivity tests, and date-stamp every input at least every six months. |
| Wealthstacker for Australian planning | Wealthstacker’s 15-year modelling tool and automated quarterly valuations support scenario-based property and retirement planning for Australian investors. |
Wealthstacker gives you a live model, not a static snapshot
Most Australians who build a wealth projection do it once, file it away, and forget it until something goes wrong. Wealthstacker is built around the opposite idea: your model should update as your circumstances do.
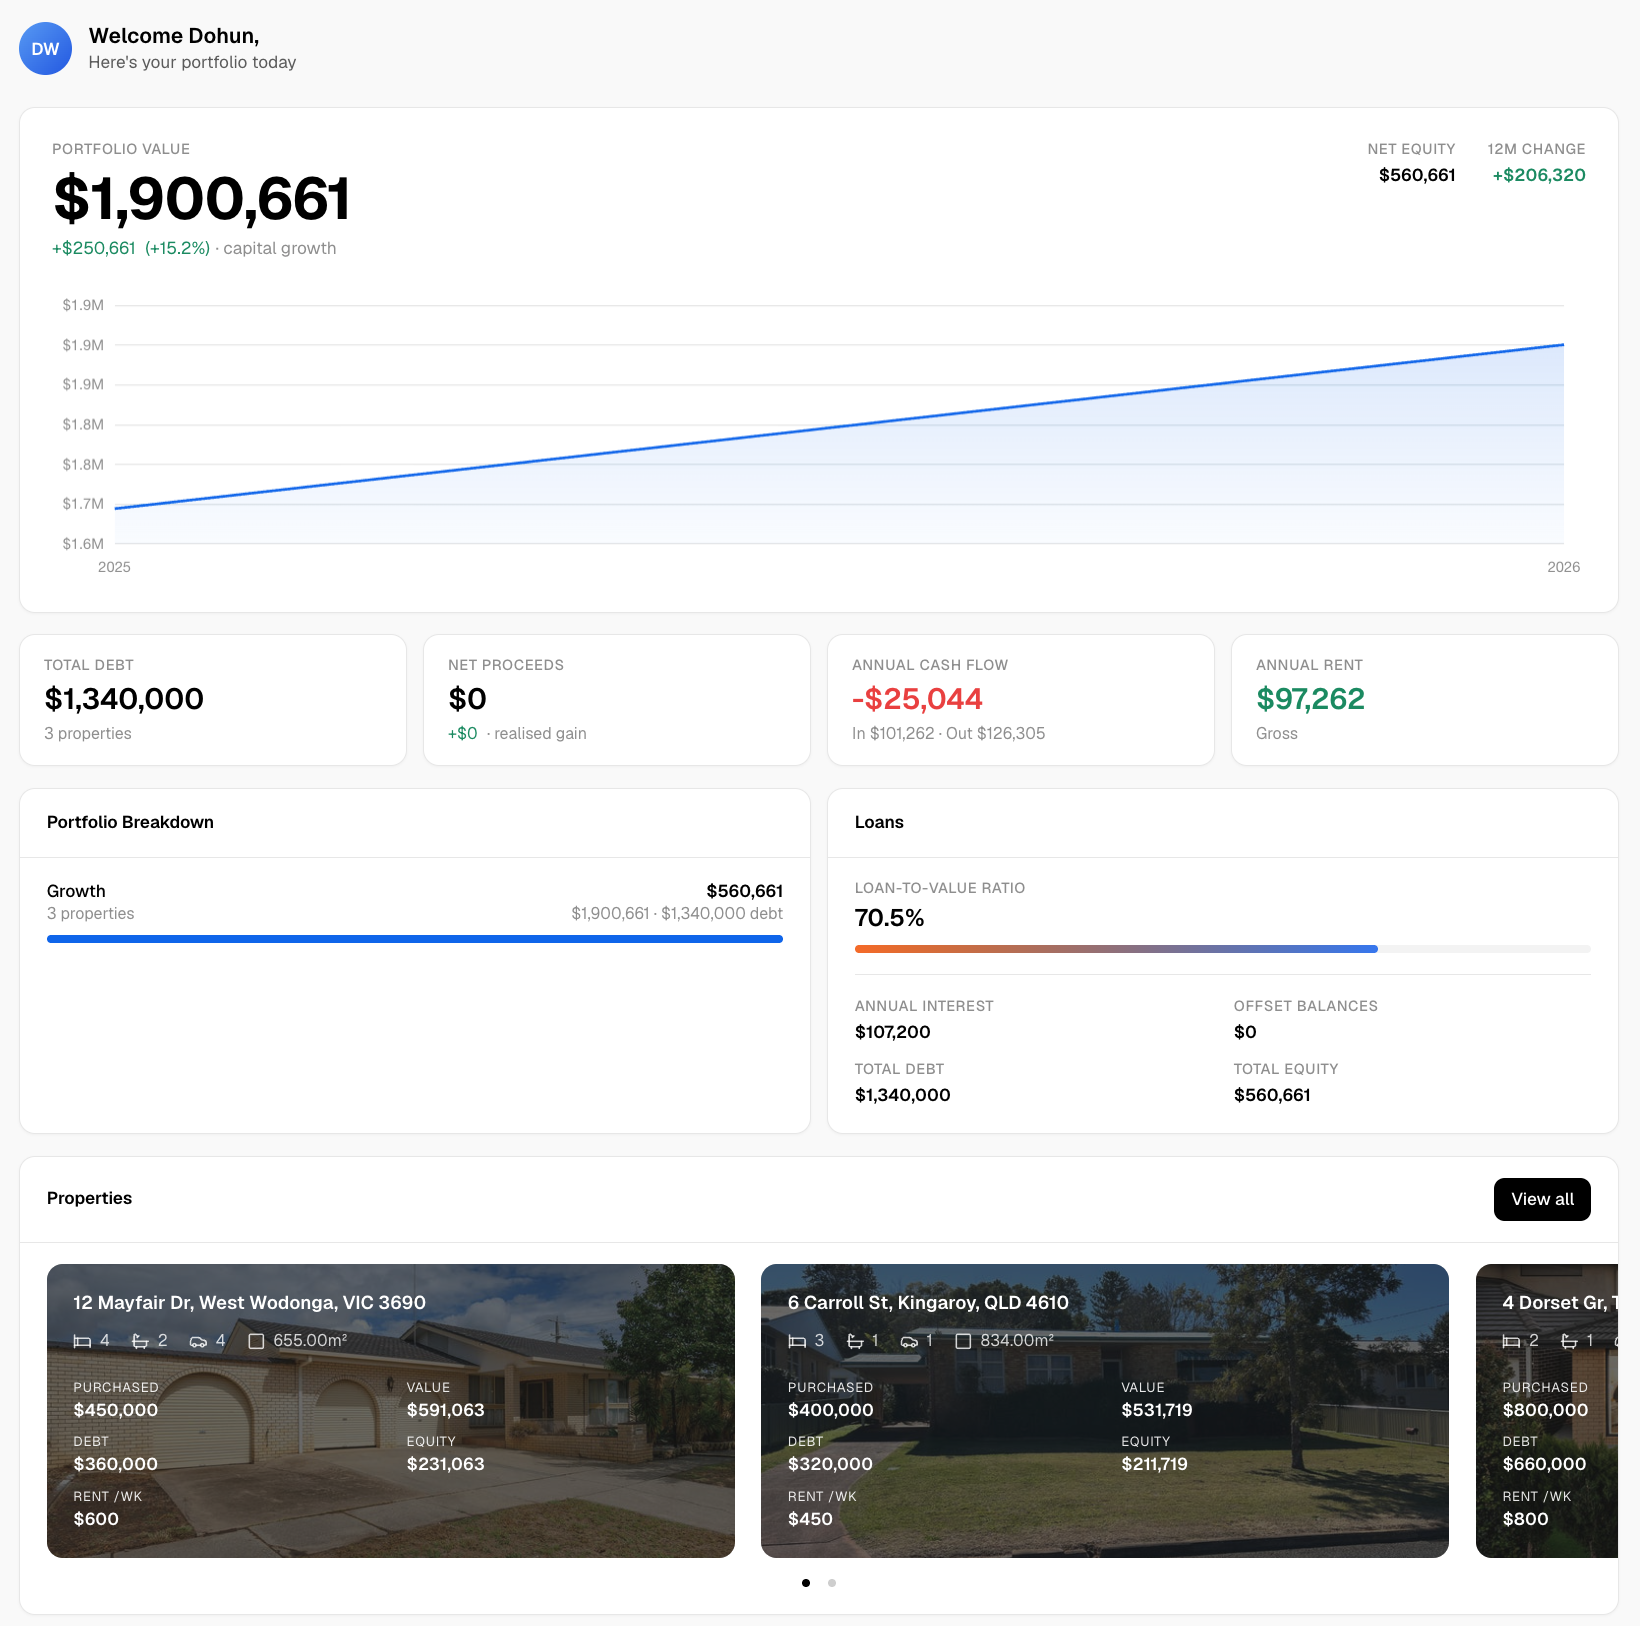
Free automated quarterly property valuations mean your largest asset stays current in the model without manual effort. The 15-year investment modelling tool lets you compare rentvesting and buying scenarios side by side, with Australian tax and borrowing assumptions built in. The goal planner and net worth tracker give you a live view of whether you are ahead or behind your retirement target, and the AI-powered chat assistant can answer specific questions about your projections as you build them.
For Australian investors who want scenario-based planning without paying for a full advisory engagement every time circumstances change, Wealthstacker covers the core modelling criteria at no cost for the base toolkit. Start your free property and wealth projection today and see where your current plan actually lands.
Useful sources for further reading
The following Australian authorities are the primary references for the rules and methods covered in this guide:
- The model — RIMGROUP description (Australian Treasury)
- Retirement planner — MoneySmart
- Crafting your retirement planning spreadsheet in Australia — Nest Egg
- Financial modelling — Findex
- How to use financial modelling to optimise your retirement — Wealth Factory
This article provides general information only and is not financial advice. Verify current super caps, Age Pension thresholds, and tax rules with the ATO, Services Australia, or a licensed financial adviser before making decisions.