
What is a property investment snapshot?
TL;DR:
- A property investment snapshot provides a data-backed overview of a property’s financial and market performance at a specific time.
- Investors improve decision-making by considering net yield, capital growth, holding costs, and local market data rather than relying on any single metric.
A property investment snapshot is a data-backed financial summary of a property’s market and income performance at a specific point in time. It captures the metrics that matter most: net rental yield, capital growth potential, holding costs, vacancy rates, and loan-to-value ratio. Australian investors have shifted sharply from gut-feel speculation toward this kind of structured, data-driven analysis. The Real Estate Institute of Australia and independent research consistently show that investors who model all six core financial factors make better decisions and avoid costly surprises at tax time. A property investment snapshot is the tool that makes that possible.
What key financial metrics compose a property investment snapshot?

A property investment snapshot draws its value from the quality of the metrics inside it. Each figure tells a different part of the story, and missing even one can lead to a flawed decision.
Gross vs. net rental yield
Gross rental yield is annual rent divided by purchase price, expressed as a percentage. Net rental yield accounts for all operating costs: council rates, strata fees, insurance, and property management. Net yield after costs gives a far truer picture of income potential than gross yield, which routinely misleads less experienced investors. Strata fees alone can reduce net yield by 1.0 to 1.5 percentage points compared with a detached house. That gap is large enough to flip a seemingly attractive deal into a cash flow negative position.
Pro Tip: Always build your snapshot around net yield, not gross yield. A property advertising a 5.5% gross yield may deliver only 3.8% net once strata, management fees, and insurance are factored in.
Cash flow and capital growth
Cash flow is the money left over after all expenses are paid from rental income. Negative cash flow is not automatically a problem, but it must be planned for. Capital growth measures how much the property’s value increases over time, and historical suburb performance is the standard starting point for estimating future growth. A property with below-average yield but strong growth drivers can outperform a high-yield property in a static suburb over ten years. That is why both figures belong in every snapshot, side by side.
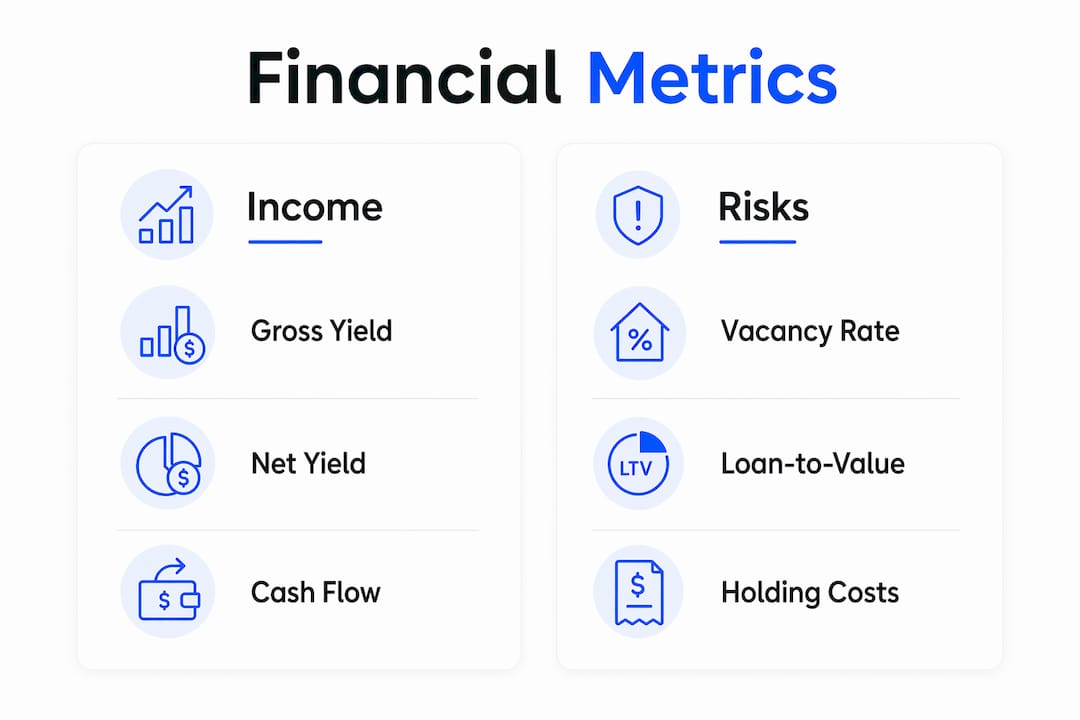
Loan-to-value ratio and vacancy rate
The loan-to-value ratio (LVR) measures your loan balance against the property’s current value. A lower LVR signals less financing risk and greater borrowing capacity for future purchases. Vacancy rate measures how often the property sits empty, which directly affects rental income. The rental yield vs capital growth relationship becomes clearer once vacancy is factored in, because a high-yield property in a high-vacancy suburb may deliver less actual income than a lower-yield property in a tightly held market.
| Metric | Definition | Typical range |
|---|---|---|
| Gross rental yield | Annual rent ÷ purchase price | 3%–6% |
| Net rental yield | Annual rent minus costs ÷ purchase price | 2%–4.5% |
| Capital growth | Annual increase in property value | 4%–10% |
| Loan-to-value ratio | Loan balance ÷ property value | 60%–80% |
| Vacancy rate | % of time property is untenanted | 1%–3% |
How do taxes and holding costs affect the snapshot’s accuracy?
Most investors focus only on rental yield and capital growth, then discover the real cost of ownership at tax time. A realistic snapshot integrates rental yield, negative gearing, depreciation, land tax, capital gains tax, and cash flow together. Leaving any of these out produces a return figure that does not reflect reality.
Negative gearing and after-tax holding costs
Negative gearing occurs when your rental income is less than your total property expenses. The shortfall is deductible against your other income, which reduces your tax bill. Negatively geared properties typically require investors to cover $100–$300 weekly after tax, depending on the property and the investor’s income. Tax savings offset 30%–50% of holding costs for investors in the 30%–45% tax brackets. That offset matters, but it does not eliminate the cash outflow.
The costs investors underestimate
The compounding impact of land tax and strata fees catches many investors off guard. These costs must be integrated into any realistic snapshot to know actual returns. The full list of costs that belong in your snapshot includes:
- Strata fees: Can reduce net yield by 1.0–1.5 percentage points for apartments.
- Land tax: Varies by state and portfolio value; often overlooked until the first bill arrives.
- Insurance: Landlord insurance and building cover are non-negotiable costs. The insurance in property investment guide covers how to factor these into your cash flow model.
- Property management fees: Typically 7%–10% of gross rent, plus letting fees.
- Maintenance and repairs: Budget at least 1% of property value annually.
Pro Tip: Model your cash flow at conservative estimates. Use an interest rate 1%–2% above your current rate and assume a 96% occupancy rate rather than 100%. If the numbers still work, the investment is genuinely sustainable.
How to interpret current market data within a property snapshot
Market data gives your snapshot its context. Without it, financial metrics float in a vacuum. As of january 2026, Australian residential property values have risen 10.2% year on year, with national vacancy rates sitting at 1.2%. These figures confirm that rental demand is strong and that asset values are growing at a pace that rewards long-term holders.
Why local indicators matter more than national averages
National figures set the backdrop, but local market indicators shape the actual rent you collect and the growth you realise. A suburb near a new hospital, university, or transport corridor carries structural growth drivers that a comparable suburb without those anchors simply does not have. Investors who include these drivers in their snapshot analysis consistently make better suburb selections. The property investment reporting guide outlines the key data points to track at a suburb level.
Reading the data without being misled
Metrics viewed in isolation mislead. A 1.2% national vacancy rate does not mean every suburb is tight. Some postcodes carry vacancy rates above 4%, which signals oversupply and weak rental demand. Similarly, a suburb showing strong historical capital growth may be at the peak of its cycle rather than the start. Structural growth drivers, including employment hubs, infrastructure investment, and population growth, are the indicators that separate a genuine opportunity from a market that has already run its course.
Practical ways to use a property investment snapshot
A snapshot is only useful if you act on it. The following steps show how to apply real estate investment analysis to real decisions.
-
Shortlist suburbs using vacancy and growth data. Filter out any suburb with a vacancy rate above 2.5% or no identifiable structural growth driver. This alone eliminates a large share of underperforming markets.
-
Calculate ROI on total initial costs. Investment snapshots work like business assessments, which means ROI must factor in stamp duty, legal fees, and building inspections, not just the purchase price. Dividing annual net income by total capital deployed gives a true efficiency figure.
-
Stress-test your cash flow. Model cash flow under conservative conditions, including higher interest rates and a 96% occupancy assumption. If the property cannot sustain those conditions, the risk is too high for most investors.
-
Track metrics over time like a business P&L. A snapshot taken once at purchase becomes outdated quickly. Reviewing net yield, vacancy, and capital growth quarterly gives you the data to decide whether to hold, sell, or refinance.
-
Use snapshots to compare strategies. Rentvesting, buy-and-hold, and positive cash flow strategies each produce different snapshot profiles. Understanding the types of property investment strategies helps you match the right approach to your financial position and goals.
A property investment snapshot treated like a living document, updated regularly and stress-tested against changing conditions, becomes one of the most reliable tools in an investor’s kit. Investors who track all metrics together, rather than cherry-picking the ones that look good, make decisions grounded in the full picture of risk and return.
Key takeaways
A property investment snapshot is only as useful as the metrics it contains. Investors who integrate net yield, capital growth, holding costs, and market data into a single, regularly updated document make consistently better decisions than those who rely on any single figure.
| Point | Details |
|---|---|
| Net yield beats gross yield | Always calculate net yield after strata, management, and insurance to avoid cash flow traps. |
| Hidden costs compound quickly | Land tax, strata fees, and insurance can reduce returns significantly if left out of the snapshot. |
| Market context is non-negotiable | National vacancy rates and capital growth figures must be localised to the specific suburb you are assessing. |
| Stress-test before you commit | Model cash flow at higher interest rates and 96% occupancy to confirm the investment is sustainable. |
| Track metrics like a business | Review your snapshot quarterly to make informed decisions about holding, refinancing, or selling. |
Wealthstacker makes property snapshot analysis straightforward
Building and maintaining a property investment snapshot takes time, data, and the right tools. Wealthstacker brings all three together in one place.
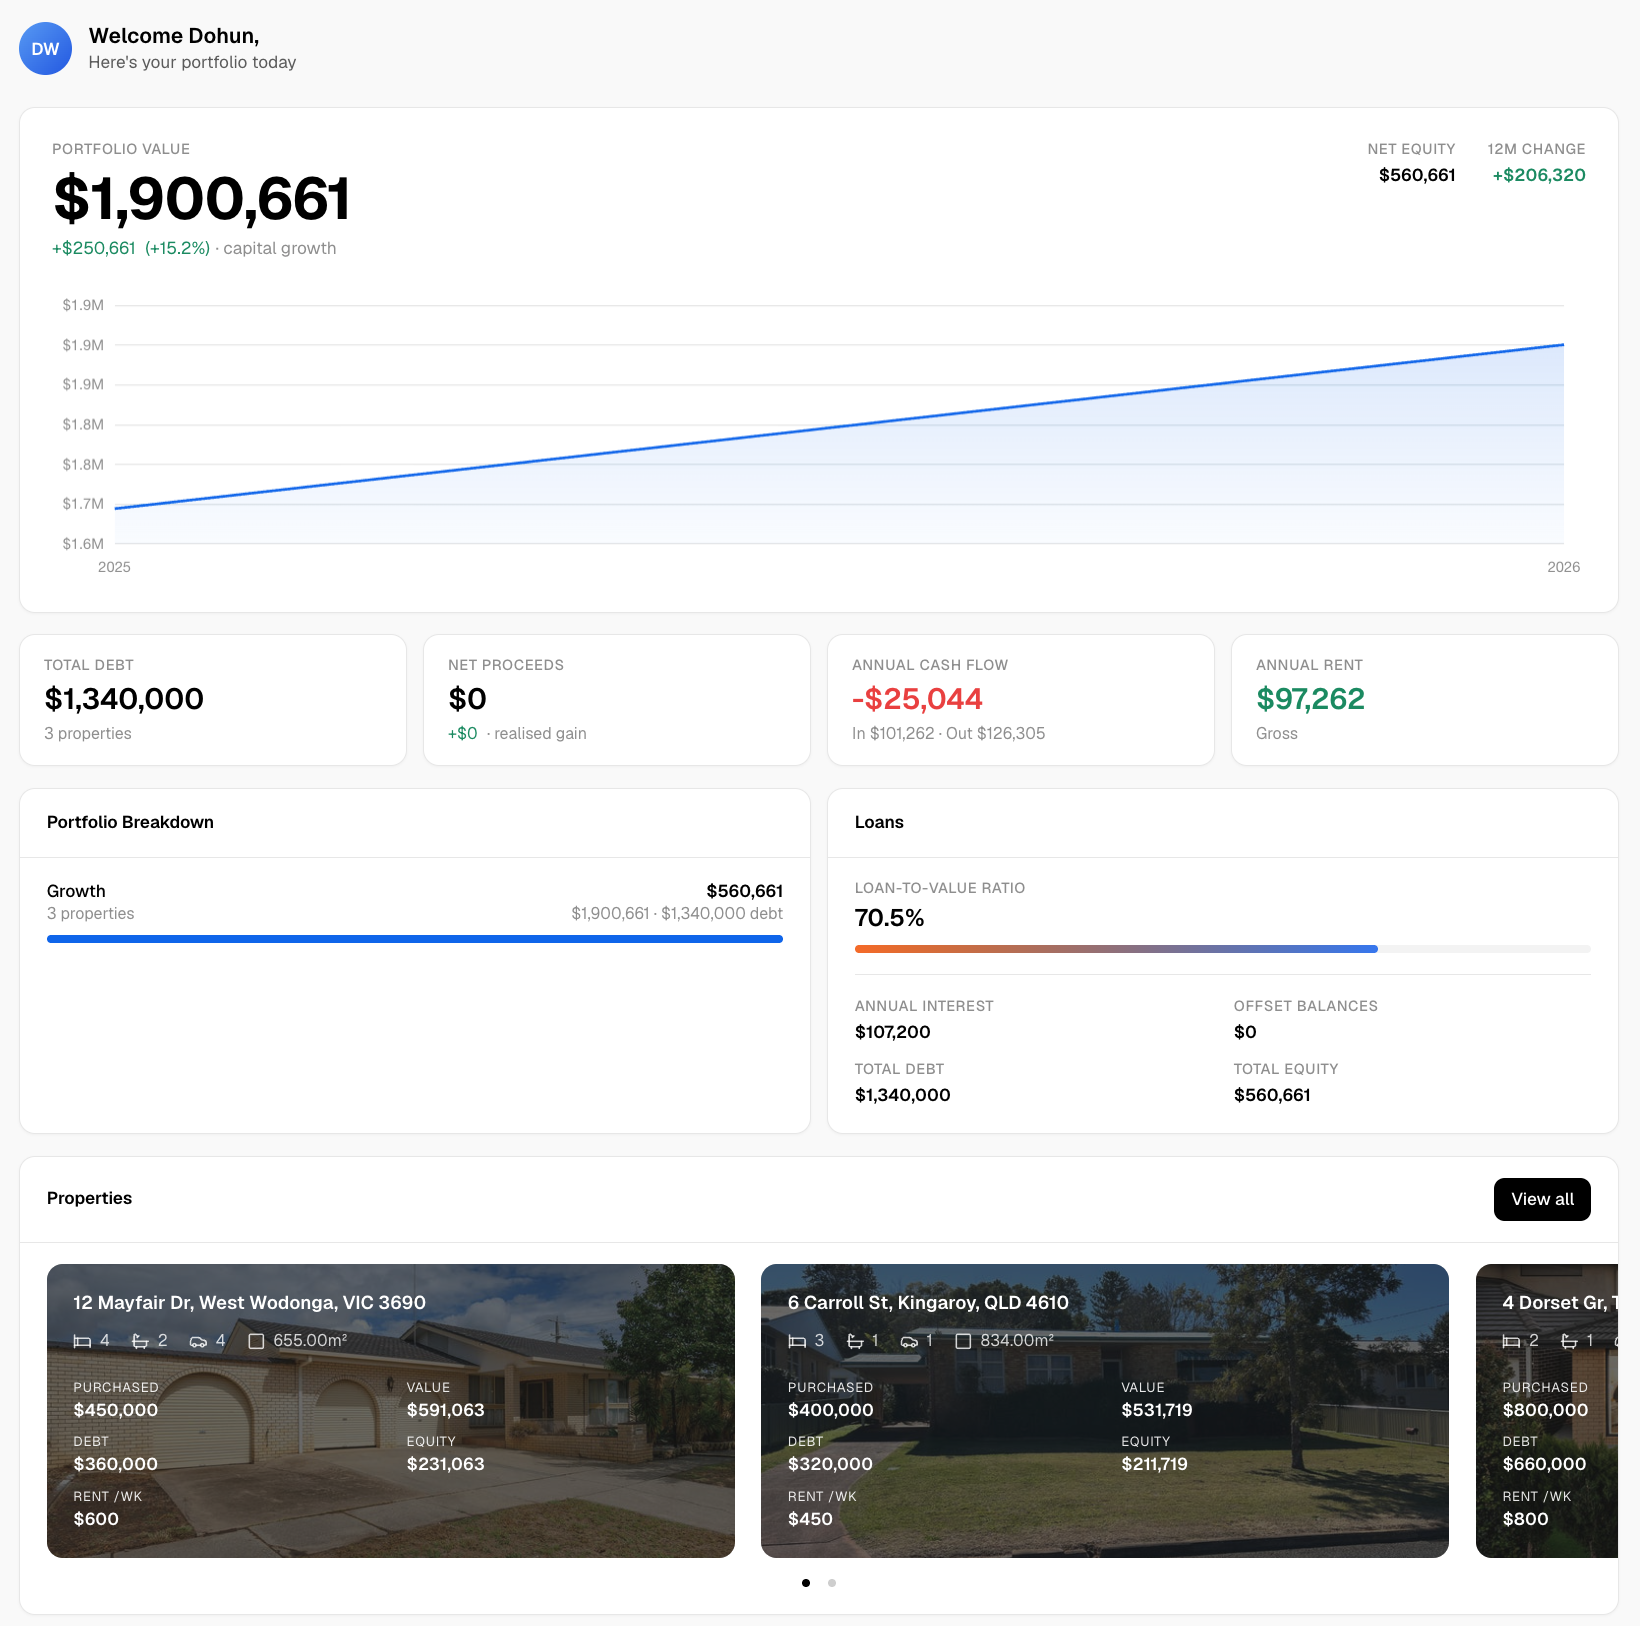
Wealthstacker’s property investment app delivers automated quarterly valuations, real-time portfolio tracking, and financial modelling for both rentvesting and buy-and-hold strategies. The platform integrates AI tools to model your net worth across different scenarios, so you can see how each property affects your overall financial position. Whether you are assessing your first investment or managing an existing portfolio, Wealthstacker gives you the metrics and forecasts you need to make decisions with confidence.
FAQ
What is a property investment snapshot?
A property investment snapshot is a data-backed summary of a property’s financial and market performance at a specific point in time. It typically includes net rental yield, capital growth potential, holding costs, vacancy rate, and loan-to-value ratio.
What is the difference between gross and net rental yield?
Gross rental yield is annual rent divided by purchase price. Net rental yield deducts all operating costs, including strata fees, insurance, and management fees, giving a more accurate picture of actual income.
How often should I update my property investment snapshot?
Reviewing your snapshot quarterly is best practice. Property values, interest rates, and vacancy rates change regularly, and an outdated snapshot can lead to poor hold or sell decisions.
Why do holding costs matter so much in a property snapshot?
Negatively geared properties can require $100–$300 weekly after tax to hold. Without modelling all costs, including land tax and strata fees, investors routinely underestimate the true cost of ownership.
How does current market data affect my investment snapshot?
Australian home values rose 10.2% in the year to january 2026, with vacancy rates at 1.2%. These figures set the benchmark for realistic rent and growth forecasts within any property investment snapshot.