
Vacancy Rate Explained: What It Means for Australian Renters and Investors
A rental vacancy rate is the share of rental properties in an area that are empty and available to rent. If 1.4% of an area’s rentals are vacant, roughly 1 in 70 is sitting without a tenant. A low figure points to strong tenant demand and rising rents. A high one points to plenty of choice and softer rents. The catch, in Australia, is that the number depends on who calculates it and how, so it is a useful signal rather than a verdict.
This guide explains what the figure measures, how it is worked out, why different publishers report different numbers for the same suburb, and how to turn it into better decisions about an investment property.
WealthstackerPut Vacancy Data in ContextWealthStacker helps you assess property investments with automated quarterly valuations, AI tools and personalized modeling for rentvesting and buying strategies.Explore WealthStackerTL;DR
- The vacancy rate is vacant rentals divided by total rental stock in an area, shown as a percentage.
- In Australia, most published rates count properties advertised online for about three weeks or more, so they are not a count of every empty home.
- Low rates generally go with faster rent growth and shorter time to find a tenant. High rates generally mean more competition for tenants.
- Providers use different methods, so compare one source over time rather than mixing sources.
- For your own numbers, convert the rate into weeks of lost rent and put it in your cash flow.
Table of Contents
- What a vacancy rate actually measures
- How the vacancy rate is calculated
- What low and high vacancy rates tell you
- What counts as a good vacancy rate?
- Why different sources give different numbers
- Where Australian vacancy rates sit now
- How vacancy rate affects an investment property
- A simple checklist for reading vacancy data
- Putting it into your own numbers
- FAQ
- Sources
What a vacancy rate actually measures
The plain definition is simple: the percentage of rental properties in a location that are empty and available for lease. The detail matters more than the definition, though.
Research from the University of Sydney’s Henry Halloran Trust explains that in Australia the rental vacancy rate typically measures online rental advertisements posted for a set duration, often three weeks or more, as a percentage of estimated rental stock. That makes it a measure of active rental market conditions and how quickly new renters are being found, rather than a census of every home with nobody in it.
The same explainer separates this from a different idea: unoccupied dwellings. These are physical homes not in use, such as holiday homes or properties sitting empty for other reasons. A suburb can have a very low advertised vacancy rate and still contain homes nobody lives in. When you read a headline about “empty homes”, check which of the two is meant.
Why the three-week filter exists
A property that was listed on Monday and leased by Friday is not a sign of a soft market. Filtering for listings that have been advertised for around three weeks screens out normal turnover and keeps the properties that are struggling to find a tenant at the asking rent. Think of it as a count of rentals that did not lease quickly.
How the vacancy rate is calculated
The formula has two parts:
Vacancy rate = vacant rental properties ÷ total rental properties × 100
The top number (the numerator) is the count of properties that qualify as vacant. The bottom number (the denominator) is the estimated total of rental properties in that area. According to the Henry Halloran Trust explainer, properties counted as vacant are typically those advertised online for 21 days or more, although methods vary by data provider.
A worked example
Say a suburb has an estimated 2,000 rental properties, and 28 of them have been advertised for three weeks or more in the month.
28 ÷ 2,000 = 0.014, or 1.4%.
Now imagine 40 properties had been listed that long. The rate becomes 2.0%, and tenants have noticeably more choice. The suburb did not change; the balance between supply and demand did.

Where the denominator comes from
Total rental stock is an estimate, not a live count. One widely quoted provider, SQM Research, takes the number of unique online listings advertised for three weeks or more in a calendar month and divides it by estimated rental stock derived from census data, according to the 2022 methodology summarised by the Henry Halloran Trust. Census data is collected every five years, so the stock estimate can drift from reality in suburbs where lots of new apartments have been completed or where homes have shifted between owner-occupied and rented.
What low and high vacancy rates tell you
The link between vacancy and rents is the core reason investors care about this number. The Henry Halloran Trust research finds that low advertised rental vacancy is strongly negatively correlated with advertised rental price metrics: as vacancy falls, asking rents tend to rise.
Economists put it in a helpful way. Commentary published by the ABC describes low vacancy as the mechanism by which rental prices adjust, much as low unemployment is how wages adjust. Landlords with few competitors can ask for more, and tenants have little room to negotiate.
| Vacancy rate pattern | What it usually signals | What it can mean for an investor |
|---|---|---|
| Very low (well under 1%) | Tenants are competing for few homes | Short gaps between tenants, stronger rent growth, less negotiating room for renters |
| Low to moderate (around 1% to 2%) | Tightish but functioning market | Steady demand, but check how your property compares with the local stock |
| Higher and rising | More choice, softer rents | Longer time to lease, more incentives, and pressure on asking rent |
| Higher in one suburb than its neighbours | A local issue, such as a new apartment release | Look into why before assuming the whole region is weak |
Treat the bands as a rough guide to interpret direction. They are not rules.
What counts as a good vacancy rate?
There is no single “healthy” number that applies everywhere. The more useful concept is the equilibrium rate. AHURI’s 2025 report, Demystifying the rental vacancy rate measure, describes it as the rate at which supply and demand are balanced and real rents stay unchanged. Below that point, rents tend to rise. Above it, they tend to ease.
The same research notes that at equilibrium there is theoretically no market failure and no immediate need for policy intervention. The practical lesson is that “good” depends on your side of the lease:
- For a landlord, a lower rate means less time between tenants and more pricing power.
- For a renter, a higher rate means more choice and more room to negotiate.
- For an investor choosing where to buy, the direction of travel often matters more than the level. A suburb moving from 3% to 1.5% is a different story from one moving from 1.5% to 3%.
Since the equilibrium rate differs by location and by how a provider measures, comparing a suburb with its own history, and with its surrounding region, is more reliable than comparing it with a fixed benchmark.
Why different sources give different numbers
You may find one website reporting 1.2% for a city and another reporting something quite different. Neither is necessarily wrong. AHURI’s critical review found that producers use different methods for both the numerator and the denominator: what qualifies as a vacant property, and how total rental stock is estimated. It also found that documentation of those methods is often sparse, which makes the figures hard to reconcile.
In practice, differences usually come from:
- The listing window. Counting ads live for 14 days versus 21 days gives different results.
- The stock estimate. Different census years or adjustments change the denominator.
- Data coverage. Some sources draw on online listings, others on property manager data or bond lodgements.
- Geography. A postcode, a suburb and a council area can tell different stories.
The habit that protects you: pick one source, use the same geography, and track it over several months. Mixing a figure from one publisher with a trend from another produces false comparisons.
Where Australian vacancy rates sit now
Rental conditions have been tight for several years, but there are signs of easing in some cities. A recent summary of SQM Research’s September 2026 release says the national vacancy rate rose to 1.4%, up from 1.3% in August, with rates still below 1% in Brisbane, Perth, Adelaide, Darwin and Hobart. The same summary describes the easing as led by Sydney and Melbourne, where more rental stock has appeared over the past year.
That is a snapshot, and monthly figures move. Check the latest release from your chosen provider before relying on any number here. The pattern to notice is the split: a national figure can hide cities moving in different directions, and a city figure can hide suburbs moving in different directions again.
Supply is part of that story. In areas where new homes depend on planning approvals, such as dual occupancy or small subdivisions in South East Queensland, the speed at which stock is added shapes vacancy over time. If you are weighing up what could add supply near a property you are considering, it helps to understand the subdivision rules in Queensland. For a wider view of how supply and demand feed prices and rents, see our guide to supply and demand in Australia’s property market.

How vacancy rate affects an investment property
Vacancy rate shows up in your finances in two ways: how long a property might sit empty, and how much rent you can ask.
Turn the percentage into weeks
A suburb-level rate is not your personal vacancy, but it helps you build a realistic allowance. Take a property renting at $600 a week:
- Full year of rent: $600 × 52 = $31,200
- Two weeks vacant: $1,200 lost, leaving $30,000
- Four weeks vacant: $2,400 lost, leaving $28,800
- Six weeks vacant: $3,600 lost, leaving $27,600
The difference between a tight and a soft market can be a few weeks of rent a year. That is real money, and you still pay the mortgage, rates and insurance while the property is empty. Build the allowance into your cash flow before you commit rather than treating a full 52 weeks of rent as the base case.
Check the yield you are really earning
Gross rental yield is annual rent divided by the property price, and it ignores vacancy. Once you subtract a realistic vacancy allowance, your effective yield is lower. Our explainer on gross rental yield walks through the formula, and why rental yield matters to property investors covers how to read it alongside other numbers.
Read vacancy with other signals
A low vacancy rate on its own does not make a good investment. Pair it with:
- Rent trend. Are asking rents rising, flat or falling over 12 months? Our piece on forecast rental growth in Australia looks at what the data says.
- Price to rent ratio. A tight rental market with an expensive purchase price may still deliver weak returns. See how to calculate and use the price to rent ratio.
- Property type. Houses and units in the same suburb can have different vacancy patterns, particularly when new apartment supply arrives.
- Your own tenant profile. Proximity to transport, universities or employment centres shapes who rents there and how stable demand is.
Vacancy for rentvestors
If you rent where you live and invest elsewhere, vacancy risk sits on the investment property while your own rent keeps running. That makes allowing for empty weeks more important, not less. Our guide to rentvesting risks in Australia covers what to check before you buy.
A simple checklist for reading vacancy data
- Find the provider’s method. Look for the listing window and how stock is estimated.
- Match the geography. Use suburb or postcode for a specific property, city for a broad view.
- Look at 6 to 12 months of history. One month can be noise.
- Compare with neighbouring areas. A suburb that stands out needs an explanation.
- Check supply in the pipeline. Approved developments can change vacancy within a year or two.
- Stress-test your cash flow. Run your numbers with four to six weeks of vacancy and see whether you are comfortable.
Putting it into your own numbers
Reading a vacancy rate is one step. Deciding what it means for your wealth over the next 15 years is another. WealthStacker is built for that second step: it provides free automated quarterly property valuations, market research tools for Australian suburbs, and 15-year modelling that lets you compare rentvesting with buying, so you can see how different assumptions, including time between tenants, may shape your outcomes.
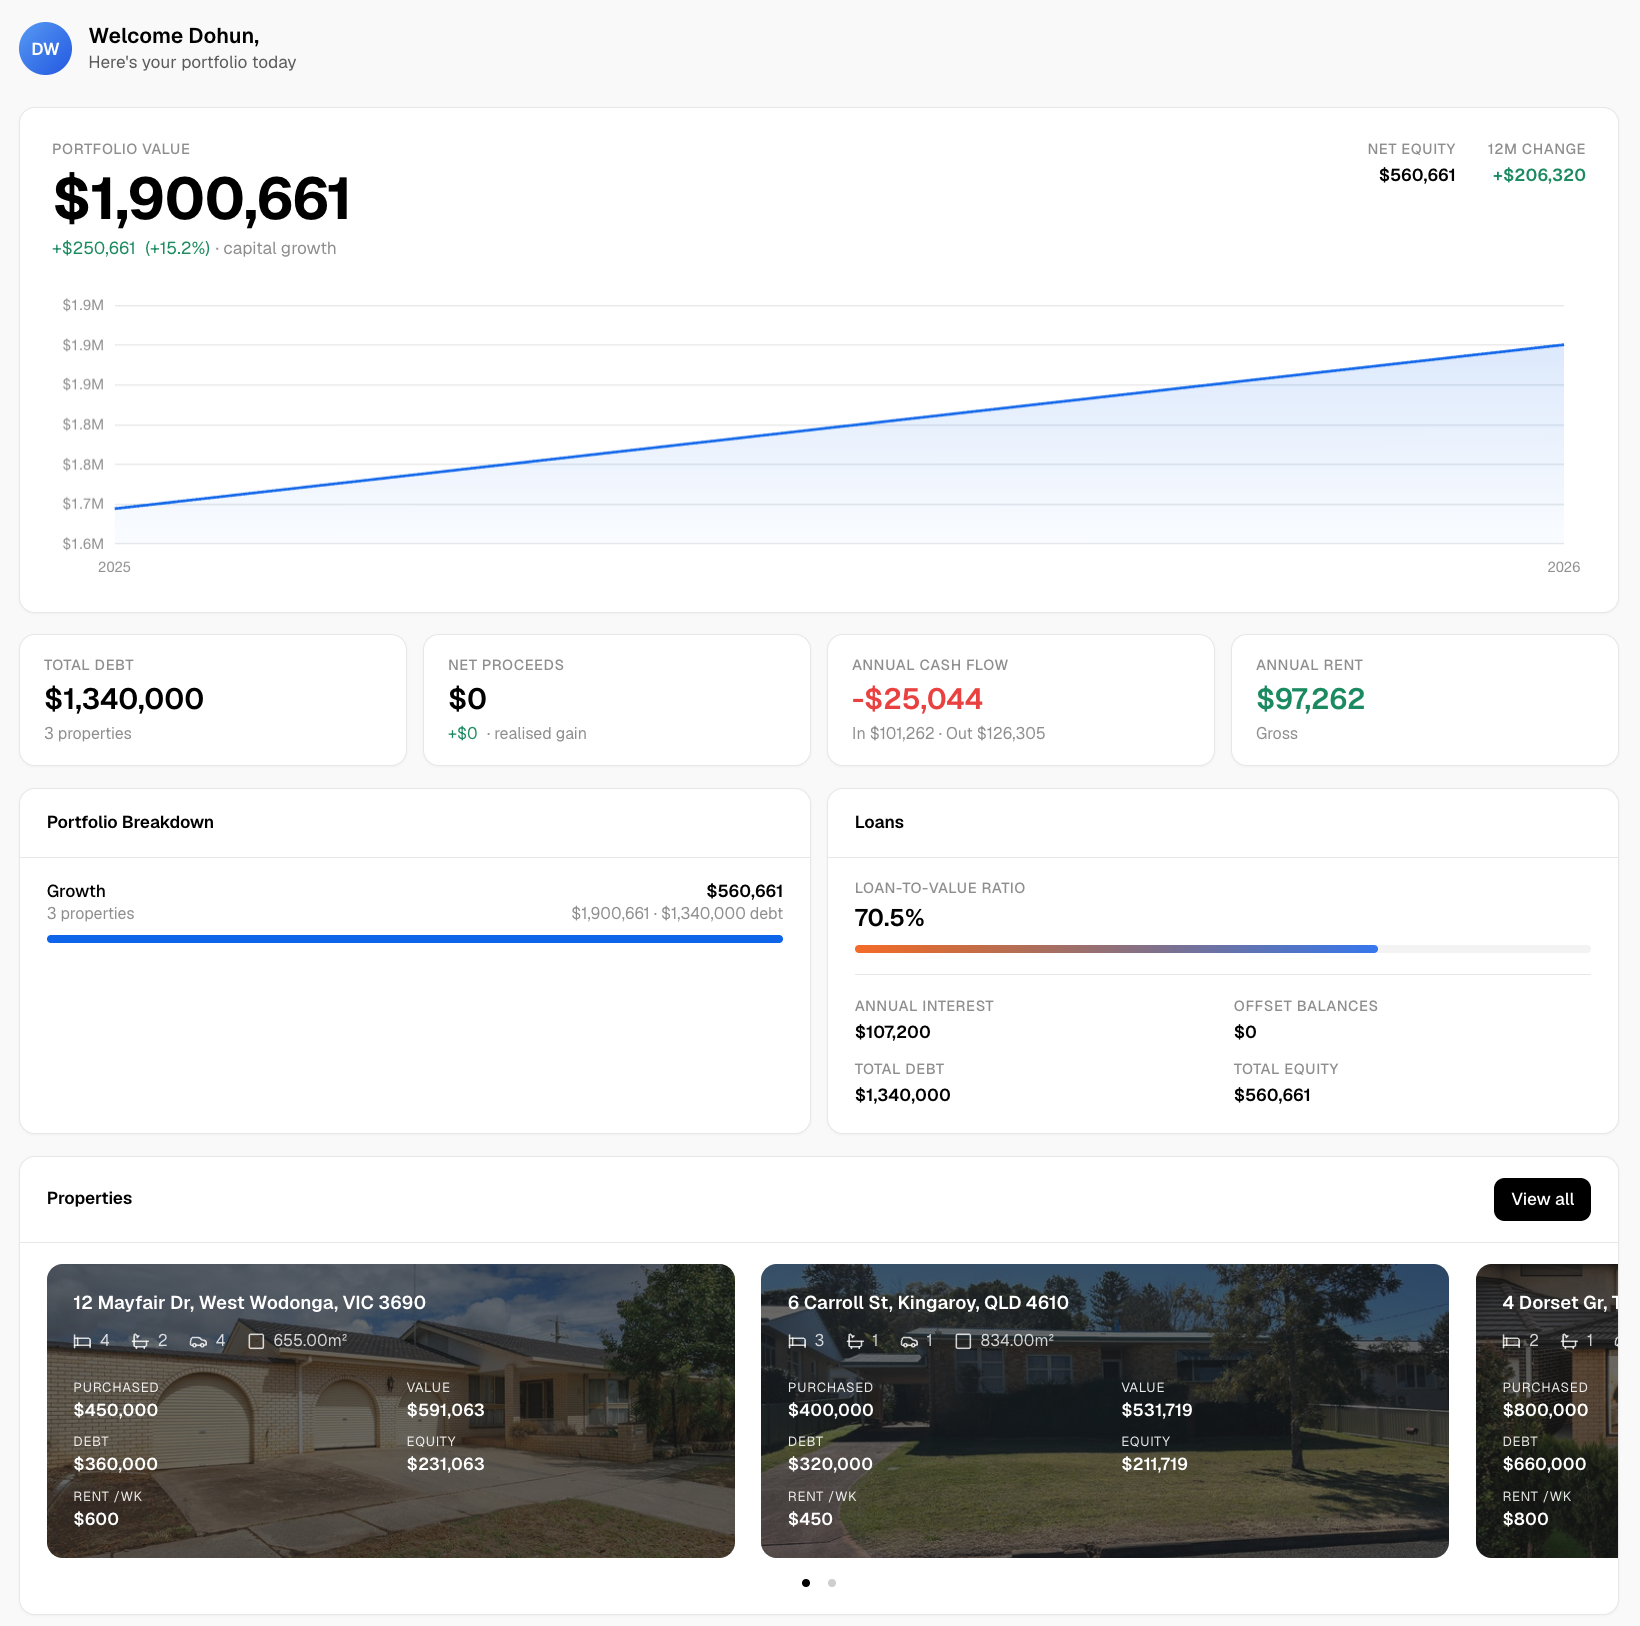
You can explore the toolkit at WealthStacker or join the waitlist to get started. If you are also weighing up how reliable an automated estimate is, see our guide on when investors need a valuer.
FAQ
What is a good vacancy rate?
There is no universal figure. A rate is generally considered balanced when supply and demand are in equilibrium and rents are not rising or falling in real terms, and that point varies by area and by how the data is measured. Landlords tend to prefer lower rates and renters higher ones. Compare a suburb with its own history and with nearby areas.
What does it mean when vacancy rates are low?
It means few rentals are sitting unleased and tenants are competing for the homes available. Research links low advertised vacancy with higher advertised rents. For investors, that usually means shorter gaps between tenants and more pricing power, though it should be read alongside purchase price and yield.
Is a high vacancy rate always bad for investors?
Not always, but it deserves a closer look. It can reflect a temporary jump in new supply, or a weak local economy. Find out which before deciding, and allow for longer vacancy periods and possible rent concessions in your cash flow.
Why does my suburb show a different vacancy rate on different sites?
Providers define vacant properties differently and estimate total rental stock differently, so their figures rarely match exactly. Stick with one source and track it over time rather than mixing numbers from several.
Sources
- Explainer: rental price and vacancy metrics, Henry Halloran Trust, University of Sydney
- Demystifying the rental vacancy rate measure, AHURI Final Report 450
- AHURI Final Report 450 full document (PDF)
- Low rental vacancy rates, housing and vacancy taxes, ABC News
- The latest rental vacancy rates around Australia, Property Update