
Time-efficient investment decision tools: a practical guide
The fastest reliable approach to investment decisions is a two-stage process: run a rapid screen first (payback period, hurdle rate filter, or rapid cost-benefit analysis), then apply a focused discounted cash flow or XIRR check only to the options that survive. This keeps most decisions to hours, not weeks, and it is the approach embedded in both Infrastructure Australia’s appraisal guidance and the Commonwealth investment toolkit. For Australian property investors, platforms like Wealthstacker compress the modelling step further with automated quarterly valuations and 15-year scenario tools.
What this workflow delivers in practice:
- Speed: a rapid screen can triage most opportunities in a few hours using minimal data
- Rigour: NPV, IRR, or XIRR modelling is reserved for shortlisted options only, so effort is proportionate
- Tool types: spreadsheets and calculators for screening; portfolio trackers, DCF tools, and automated valuation models (AVMs) for deeper analysis
Table of Contents
- What do “time-efficient investment decision tools” actually mean?
- Core appraisal techniques: which one should you use?
- A five-step workflow with Australian practice notes
- What tool categories should you actually use?
- How do you choose the right tool for your role?
- What are the standard Australian defaults for quick appraisals?
- How does real-time market data speed up decisions?
- How do AI and decision-support systems help with predictive analytics?
- What are the fastest risk management shortcuts?
- Real Australian investment scenarios: the workflow in action
- Key takeaways
- Authoritative Australian sources and further reading
- Wealthstacker puts this workflow in your hands
What do “time-efficient investment decision tools” actually mean?
The phrase covers two distinct categories that are often conflated. Screening tools are fast, low-data instruments designed to discard non-viable options quickly. Appraisal tools are slower, higher-precision instruments used to rank and validate the options that survive screening. Conflating the two is where most investors lose time: running a full DCF on every opportunity is the equivalent of sending every job application to a panel interview.
For solo investors, the priority is a reliable go/no-go signal within a sitting. For asset managers, the need shifts to repeatable, auditable shortcuts that can process a pipeline of opportunities without creating governance risk. Both audiences benefit from the same underlying principle: use the simplest metric that reliably discards most non-viable options before committing to detailed modelling.
The NSW Government Guidelines for economic appraisal draw a useful distinction here: cost-benefit analysis (CBA) is appropriate where benefits can be monetised; cost-effectiveness analysis (CEA) suits situations where benefits are harder to quantify. Knowing which you need before you open a spreadsheet saves time on its own.
Core appraisal techniques: which one should you use?
Each metric has a natural home in the decision process. Using the wrong one at the wrong stage is a common source of wasted effort.
Payback period is the fastest triage metric available. Calculate it in seconds: divide the initial outlay by the annual net cash inflow. Its blind spot is significant: it ignores the time value of money entirely, so two projects with identical payback periods can have very different NPVs. Use it to eliminate obvious outliers, not to rank survivors.
Rapid CBA goes one step further. Infrastructure Australia’s Assessment Framework describes it as a lower-rigour screening variant that quantifies only the most material economic costs and benefits. It is suited to Stage 2 submissions and early triage, not final investment decisions.
NPV, IRR, and XIRR belong at the modelling stage. NPV gives an absolute dollar value of an investment at a chosen discount rate. IRR gives the rate at which NPV equals zero. Both are standard, but IRR assumes cashflows are reinvested at the IRR itself, which is rarely realistic. For property development or any project with irregular cashflows, XIRR is the correct tool: it accounts for actual dates rather than uniform periods. A one-year delay in a development project can significantly reduce equity IRR, which is why date-aware modelling matters.
BCR and IBCR (benefit-cost ratio and incremental BCR) are most useful when you are ranking competing options under a fixed budget. ATAP guidance covers the stepwise calculation of NPV, BCR, and IBCR alongside discounting conventions.
- Payback period: screening only, fast, ignores time value
- Rapid CBA: early triage, quantifies material costs and benefits
- NPV: absolute value at a chosen discount rate, modelling stage
- IRR: rate-of-return metric, assumes uniform reinvestment
- XIRR: IRR for irregular cashflows, use for property and development
- BCR/IBCR: ranking under budget constraints
Pro Tip: Start with payback to cut the list, then run XIRR only on the survivors. Running a full DCF on every candidate is the single biggest time drain in investment analysis.
A five-step workflow with Australian practice notes
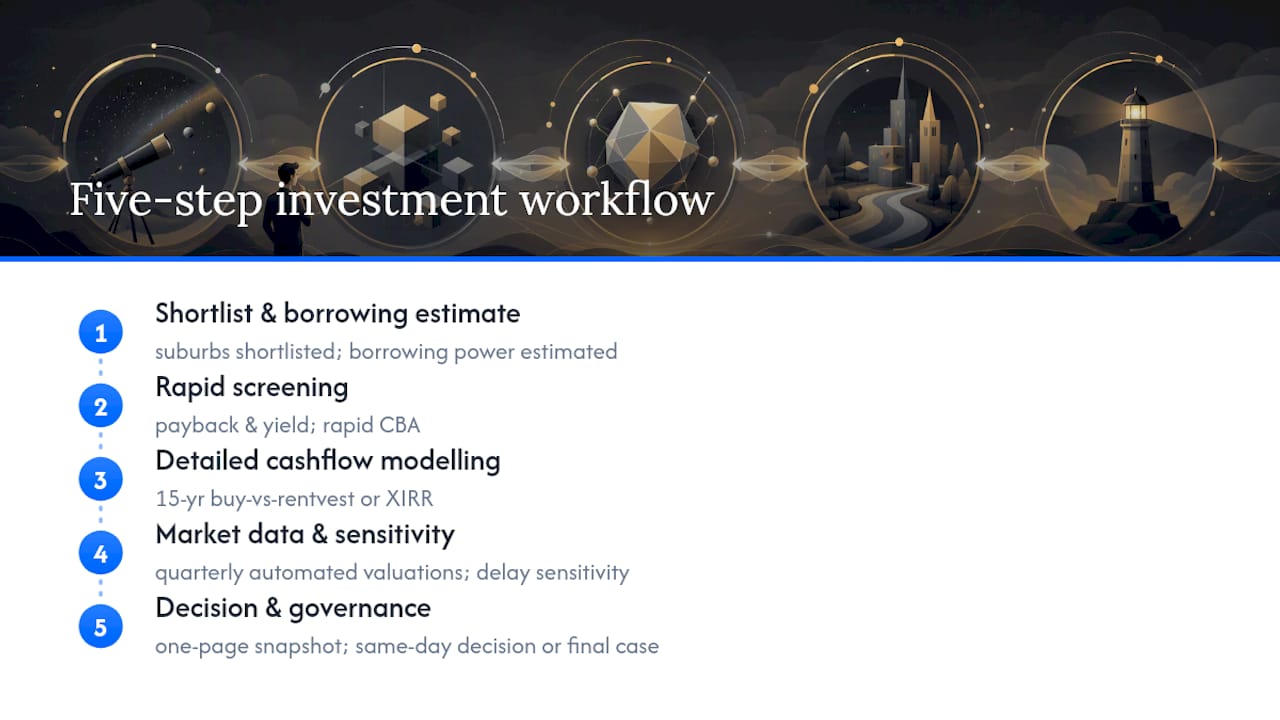
A repeatable workflow removes the decision fatigue of choosing a method each time. The Commonwealth 3-step commercial assessment provides a government-grade template for first-pass evaluation; the five steps below adapt that logic for individual and institutional property investors.
- Rapid screen (hours): apply a payback filter and a hurdle rate check. RBA liaison evidence shows Australian firms commonly set hurdle rates well above their weighted average cost of capital and use short payback cutoffs for triage. If an opportunity fails both, it is out.
- Focused DCF/XIRR checks: run XIRR on actual projected cashflow dates for each shortlisted option. For a property buy-versus-rent scenario, Wealthstacker’s 15-year modelling tools and automated quarterly valuations replace the manual data-gathering that typically consumes most of this step.
Mini case example: an investor comparing buying a property in a Sydney suburb versus continuing to rentvest runs the five steps in an afternoon. Steps 1 and 2 use Wealthstacker’s suburb market research tools and borrowing power estimator to screen the opportunity. Step 3 uses the platform’s 15-year net worth modelling to generate XIRR-equivalent scenario outputs for both strategies. Step 4 tests sensitivity to a 12-month settlement delay. Step 5 produces a one-page snapshot using the investment snapshot template before the decision is made.
Pro Tip: A one-page investment snapshot that records your assumptions, hurdle rate, and top three sensitivities takes 15 minutes to complete and cuts governance review time significantly.
What tool categories should you actually use?
The right tool depends on the task, not personal preference. Here is how the categories map to typical investment tasks:
Lightweight calculators and templates suit initial payback and hurdle checks. A well-structured spreadsheet template with pre-built XIRR functions handles most individual investor needs up to portfolio sizes of around five to ten properties.
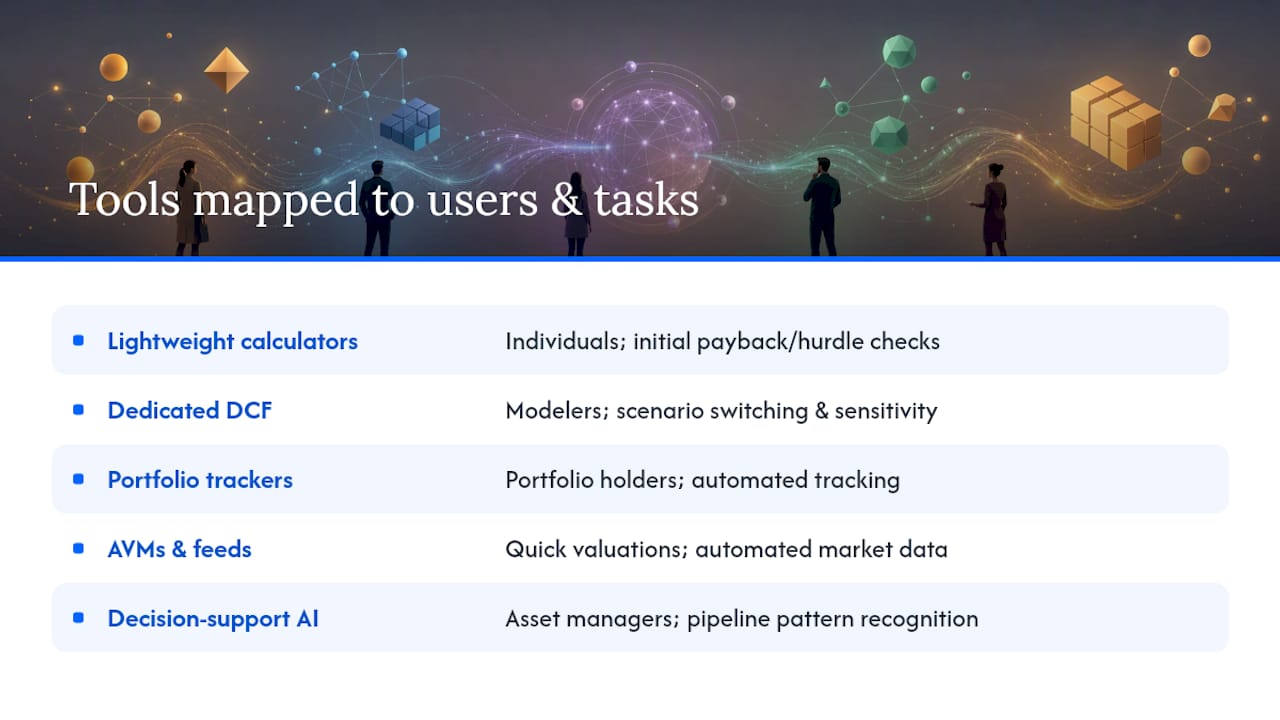
Dedicated DCF calculators add scenario-switching and sensitivity tables without requiring spreadsheet expertise. They are worth the switch when you are modelling more than two or three scenarios per opportunity.
Portfolio trackers and dashboards become necessary once you hold multiple assets and need to monitor performance against benchmarks without rebuilding a spreadsheet each quarter. Wealthstacker’s portfolio tracking dashboard automates this for Australian property, pulling in automated quarterly valuations so you are not manually sourcing comparable sales data.
AVMs and market data feeds are the category where automation delivers the clearest time saving. Manual valuation research for a single property can take hours; an AVM delivers a credible estimate in seconds. Wealthstacker provides free automated quarterly valuations, which is a meaningful shortcut for investors who need current market data without paying for a formal appraisal each time.
Decision-support and AI tools sit at the top of the stack. They are most useful for asset managers processing a pipeline, where pattern recognition across many opportunities adds value that a single-asset calculator cannot.
For individual investors, a spreadsheet with XIRR plus an AVM-backed portfolio tracker covers most needs. Asset managers running ten or more active opportunities should look at SaaS workflows that integrate data feeds, modelling, and alerts in one place.
How do you choose the right tool for your role?
A short checklist cuts the decision time considerably.
- Define your core need: are you screening (fast, low-data) or modelling (slower, high-precision)?
- Check data availability: a tool is only as fast as its data inputs. If you have to manually source every input, the tool’s speed advantage disappears.
- Confirm auditability: asset managers and advisers need outputs they can show to a compliance team. Spreadsheets are auditable; black-box tools are not.
- Test real-time integration: does the tool connect to live market feeds, or does it require manual updates? Manual updates are the hidden time cost most buyers overlook.
- Assess cost against time saved: a tool that saves two hours per decision at $50 per month pays for itself quickly at any professional billing rate.
- Check governance fit: does the tool produce outputs in a format your organisation’s investment committee will accept?
Red flags that a tool will slow you down rather than speed you up:
- Requires more than three manual data inputs per opportunity before producing any output
- No export function for assumptions and results
- No sensitivity or scenario toggle
- Vendor cannot demonstrate the tool with your own data in a trial
Pro Tip: Trial any new tool on one live opportunity before committing. If it does not produce a credible first output faster than your current method, it will not save time at scale either.
What are the standard Australian defaults for quick appraisals?
These figures are starting points for rapid screens, not substitutes for project-specific analysis.
| Parameter | Common Australian default | Source |
|---|---|---|
| Discount rate (public infrastructure) | 7% real (central estimate) | ATAP / Infrastructure Australia |
| Hurdle rate (private firms) | Often well above WACC; RBA liaison data notes rates are high and sticky | RBA Bulletin, June 2015 |
| Payback cutoff (screening) | 1–3 years for capital-constrained triage | RBA / practitioner convention |
| BCR threshold (public projects) | BCR > 1.0 to proceed; IBCR used for ranking | ATAP CBA guidance |
A few practical notes on applying these defaults:
- The 7% real discount rate is an Infrastructure Australia reference for public infrastructure; private property investors typically use a nominal rate that reflects their cost of capital and risk premium
- High, sticky hurdle rates in Australian firms act as an implicit risk buffer, but RBA research notes this can cause viable long-term projects to be rejected when rates are set and forgotten
- For rapid screens, a payback cutoff of two years is a common first filter; projects that clear it move to BCR ranking before any DCF work begins
- Always test NPV and BCR across at least two discount rates before treating a result as final
Key figure: Infrastructure Australia’s appraisal framework describes rapid CBA as appropriate for early-stage screening where full modelling would be disproportionate to the decision at hand.
How does real-time market data speed up decisions?
The biggest time drain in most investment workflows is not the analysis itself. It is sourcing current data. By the time a manual comparable-sales search is complete, the market may have moved. Real-time data feeds and automated alerts remove this bottleneck.
For Australian property investors, the practical applications are: suburb-level price movement alerts that flag when a target market crosses a threshold; automated valuation updates that replace quarterly manual research; and rental yield feeds that keep DCF assumptions current without manual refreshes. Wealthstacker’s portfolio monitoring tools address this directly, combining automated valuations with market research overlays for Australian suburbs.
Asset managers benefit from a slightly different configuration: pipeline-level alerts that flag when an opportunity’s metrics cross a pre-set hurdle, rather than monitoring individual assets. The principle is the same: set the threshold once, let the system flag exceptions, and reserve human attention for decisions rather than data collection.
How do AI and decision-support systems help with predictive analytics?
AI tools in investment analysis currently do two things well: pattern recognition across large datasets (identifying which suburb characteristics correlate with above-average capital growth, for example) and scenario generation (producing a range of outcomes from a set of variable inputs faster than a manual model). What they do less well is replace the judgement call at the end of the process.
Wealthstacker’s AI-powered investment chat assistant sits in the decision-support category: it helps investors interrogate assumptions and explore scenarios without requiring them to rebuild a model from scratch. For investment property forecasting, this kind of tool compresses the time between “I have a shortlisted opportunity” and “I have a modelled view of its likely outcomes.”
The practical limit is data quality. An AI tool trained on historical price data will not predict a policy change or a local infrastructure announcement. Use predictive analytics to narrow the range of plausible outcomes, not to replace scenario testing on the inputs you can control.
What are the fastest risk management shortcuts?
Three shortcuts cover most of the risk exposure in a rapid appraisal:
Sensitivity to timing. For property development, a one-year delay can cut equity IRR by roughly a third, as Feasly’s Australian developer guide demonstrates. Run a single delayed-settlement scenario on every shortlisted opportunity before committing.
Hazard and risk overlays. Flood, bushfire, and infrastructure risk affect both insurability and long-term capital growth. Wealthstacker includes hazard and risk analysis overlays as part of its property research toolkit, which means this check takes seconds rather than requiring a separate search across multiple government databases.
Concentration risk check. A two-minute portfolio review that flags overexposure to a single suburb, property type, or tenant profile catches the most common source of portfolio-level risk before it compounds.
None of these shortcuts replace a full risk assessment for a major capital commitment. They are filters designed to surface the risks most likely to change a decision, quickly enough to act on them before the opportunity closes.
Real Australian investment scenarios: the workflow in action
Scenario 1: Individual investor, first investment property. An investor in Melbourne has three suburbs shortlisted. Using Wealthstacker’s suburb research tools and borrowing power estimator, they run a payback and yield screen on all three in under an hour. One suburb fails the hurdle rate filter immediately. The remaining two go to a 15-year buy-versus-rentvest model. The platform’s automated quarterly valuations provide current market data without manual research. The investor documents assumptions in a one-page snapshot and makes a decision the same day.
Scenario 2: Asset manager, commercial property pipeline. A small asset management firm is evaluating six opportunities. They apply a rapid CBA filter aligned with Infrastructure Australia’s screening approach to cut the list to three. XIRR modelling on actual cashflow dates, following Feasly’s timing guidance, reveals that two of the three have IRRs that are highly sensitive to a six-month settlement delay. One opportunity survives to full appraisal. The Commonwealth 3-step commercial assessment framework provides the governance structure for the final business case.
Both scenarios follow the same five-step workflow. The tools differ by scale; the logic does not.
Key takeaways
The most time-efficient investment decisions combine a rapid payback or hurdle-rate screen with XIRR modelling on shortlisted options only, using automated data tools to eliminate manual research steps.
| Point | Details |
|---|---|
| Screen before you model | Apply a payback or hurdle filter first; run DCF only on survivors to avoid wasted modelling effort. |
| XIRR over IRR for property | Use XIRR on actual cashflow dates; a one-year delay can cut equity IRR by roughly a third. |
| Use Australian defaults as starting points | A 7% real discount rate (ATAP/Infrastructure Australia) and a 1–3 year payback cutoff are common first-pass benchmarks. |
| Document a one-page snapshot | Record assumptions, hurdle rate, and key sensitivities before every decision to preserve speed and auditability. |
| Wealthstacker cuts manual steps | Automated quarterly valuations, 15-year modelling, and hazard overlays replace hours of manual data gathering for Australian property investors. |
Authoritative Australian sources and further reading
- Assessment Framework 2021: Guide to economic appraisal
- Firms’ investment decisions and interest rates
- NSW Government Guidelines for economic appraisal
- 3 step commercial assessment
- Cost–Benefit Analysis guidance
- IRR for property development: Australian developer guide | Feasly
- Property Investment App & Portfolio Tracker | WealthStacker
This article provides general information only and is not financial or investment advice. Confirm current rates, thresholds, and appraisal requirements with a qualified professional or the relevant primary source.
Wealthstacker puts this workflow in your hands
Free quarterly valuations and 15-year scenario modelling in one place: that is the concrete difference Wealthstacker offers over building the same workflow manually in spreadsheets. For Australian property investors who have just read this guide, the two steps that consume the most time — sourcing current market valuations and running buy-versus-rentvest scenarios — are handled automatically.
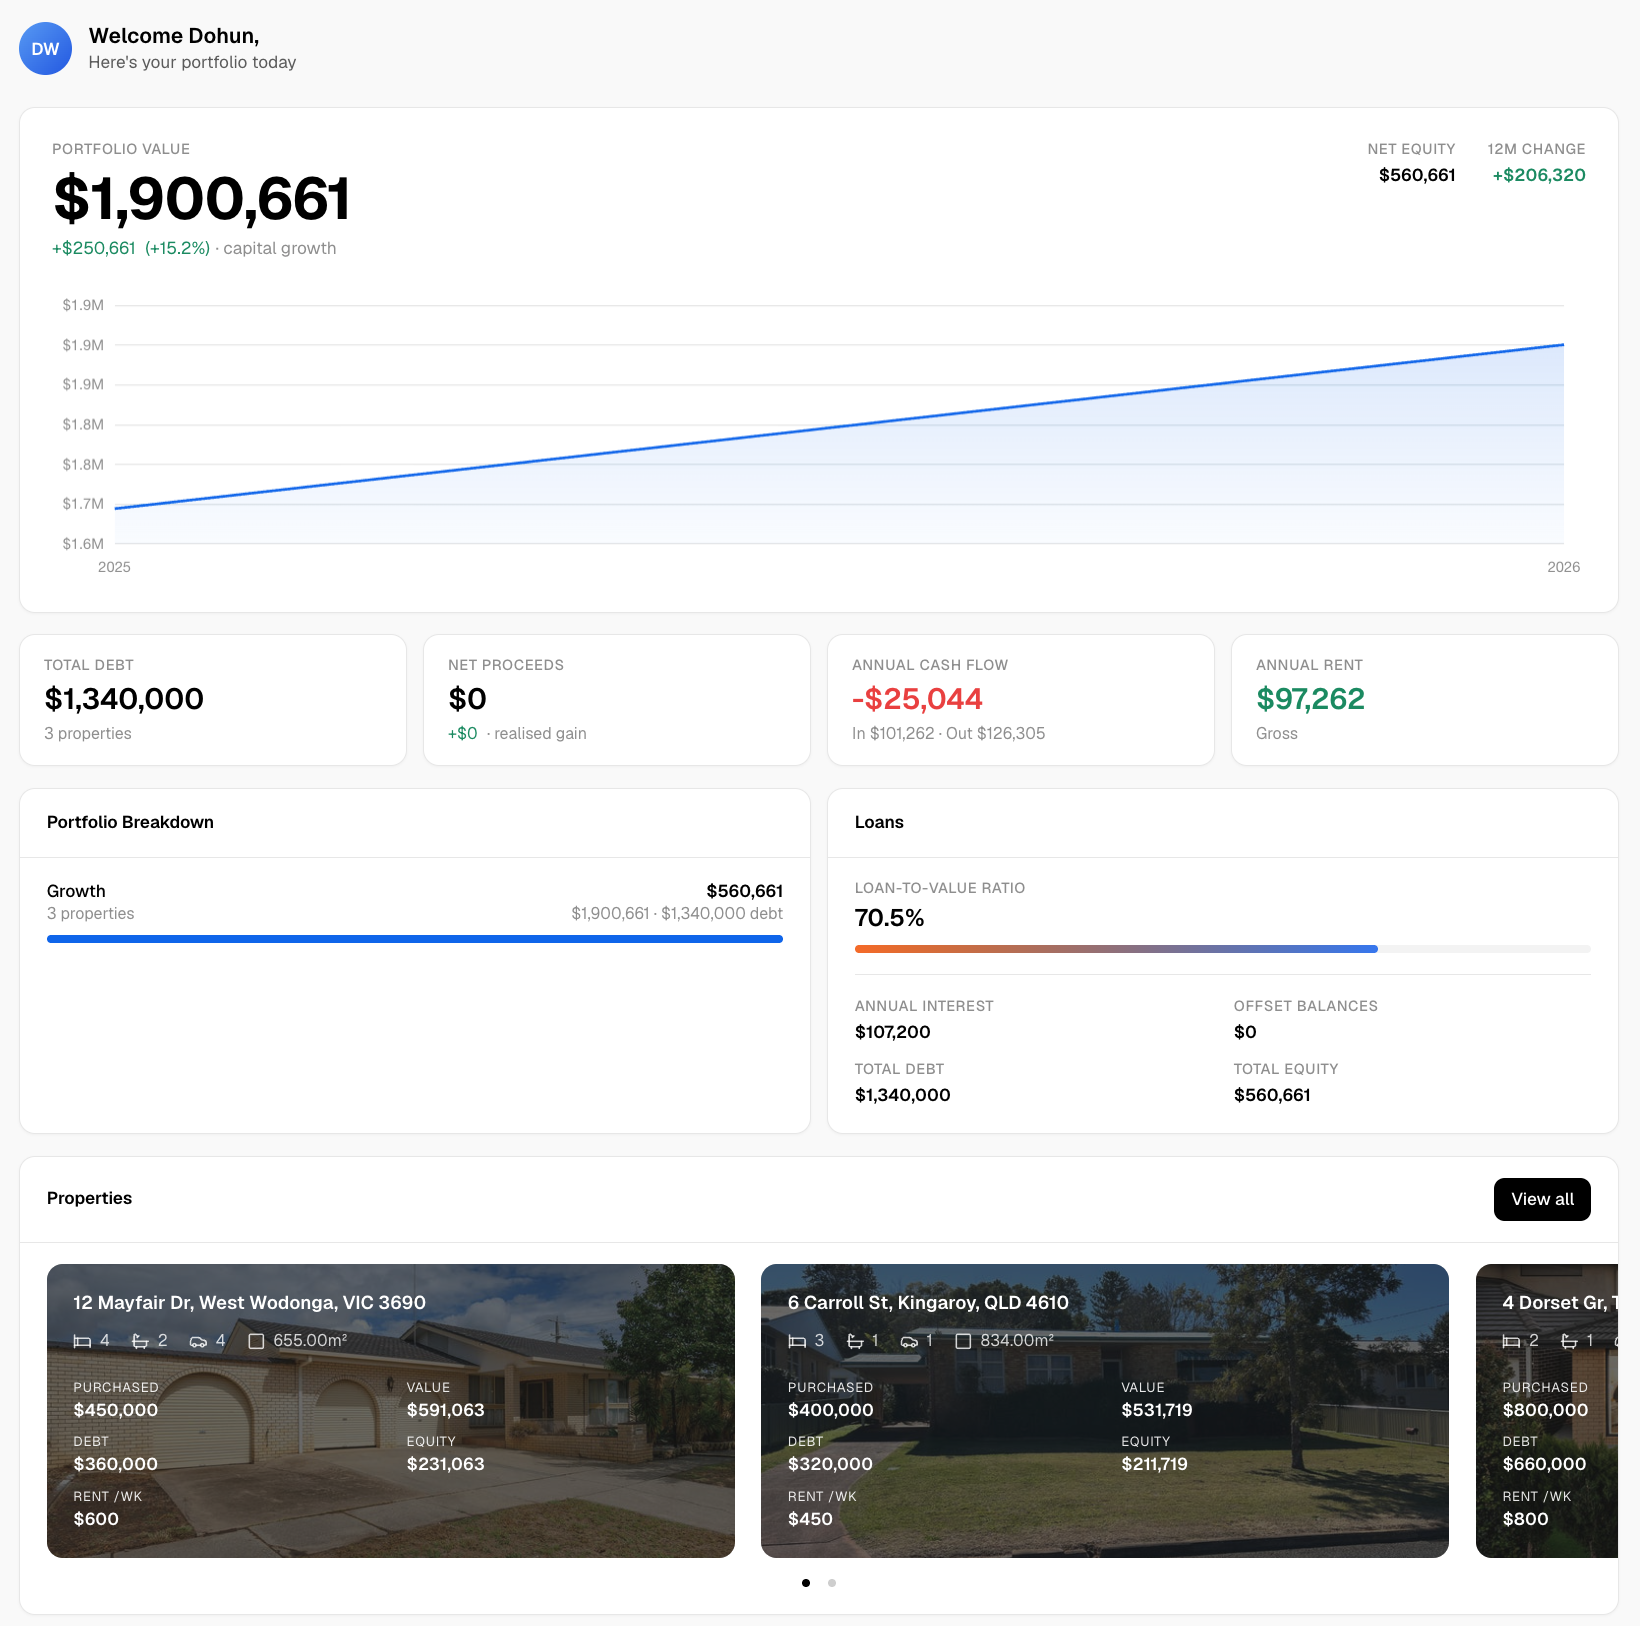
Wealthstacker’s property investment toolkit includes automated quarterly valuations at no cost, a portfolio tracking dashboard, 15-year net worth modelling for both buying and rentvesting strategies, hazard and risk overlays, suburb market research tools, and an AI-powered investment chat assistant. Asset managers and individual investors both get the same starting point: current data, without the manual research bill.
The next step is straightforward. Visit Wealthstacker, run the automated valuation on one property you are currently evaluating, and compare it against your existing data. If it saves you an hour on the first use, the workflow case makes itself.