
What role does AI play in forecasting property returns?
AI’s role in forecasting property returns is to widen the data an investor sees and speed up how many scenarios they can test, not to replace the judgement call at the end. Machine learning models can chew through comparable sales, listing volumes, and macro indicators far faster than a human analyst, flagging early signals a slowing suburb or a coming price shift. But AI should augment, not replace, human forecasters, because it lacks the contextual judgement needed for one-off property quirks. Treat every AI output as a conditional projection, not a promise.
- Use AI for rapid valuations, early signal detection, and scenario sweeps across many properties at once.
- Treat every forecast as directional. It shows a plausible path, not a guaranteed outcome.
- Always verify with local data and sensitivity testing before you commit capital.
Key Takeaways
AI forecasting works best as a fast, wide-lens screening tool that surfaces signals and scenarios for humans to verify, not a substitute for local judgement and stress testing.
| Point | Details |
|---|---|
| AI augments, doesn’t replace | Use forecasts to surface signals and speed scenario testing, then verify with local expertise. |
| Ensembles drive most models | Gradient boosting and stacked ensembles remain the standard for price prediction accuracy. |
| Small markets need recalibration | National models often misfire in smaller regional markets without local adjustment. |
| Exit-cap sensitivity is critical | Small cap-rate shifts can swing a five-year IRR by several percentage points. |
| Governance prevents blind trust | Require documented assumptions, backtests, and human sign-off before acting on any forecast. |
Table of Contents
- How AI forecasts property values and returns
- Where AI forecasting excels, and where it breaks down
- A practical workflow for using AI forecasts in investment decisions
- How to read model outputs and validation metrics
- Managing bias and governance risk in AI property forecasts
- How Wealthstacker applies AI forecasting to real portfolios
- A checklist before you trust an AI property forecast
- Try Wealthstacker’s free quarterly valuations and scenario tools
- Sources
How AI forecasts property values and returns
Most property AI tools run on ensemble models. Gradient boosting machines (like XGBoost) and stacked ensembles combine dozens of weaker predictors into one sturdier estimate, which is why they’ve become the default choice for price prediction over single decision trees. Neural networks show up too, particularly where the data includes images or unstructured text.
The data feeding these models splits into two camps. Traditional inputs include comparable sales, transaction history, and macro indicators like interest rates and population growth. Alternative data has expanded that picture considerably: listings flow, auction clearance rates, satellite imagery of construction activity, job postings, and even card spend proxies for local retail health. Some newer approaches go further still, pulling sentiment signals out of news text with large language models to improve return forecasts for real estate investment trusts, a technique that’s slowly filtering down into direct property analysis.
Explainability matters as much as accuracy here. Feature importance rankings and SHAP values let you see which inputs are actually driving a given number.
- Ensemble trees and neural nets dominate price prediction work.
- Alternative data (auction results, imagery, sentiment) is filling gaps traditional comps miss.
- SHAP and feature importance turn a black box into something you can interrogate.
Where AI forecasting excels, and where it breaks down
AI is genuinely strong at processing high volumes of signals simultaneously and ranking hundreds of suburbs by momentum in minutes, work that would take a human analyst days. It’s also useful for spotting early turning points, since models can pick up shifts in auction clearance or listing volume before they show up in median price data.
The failure modes are just as real. National models trained on capital-city data routinely misfire in smaller regional markets, and practitioners warn against trusting them in smaller markets without local recalibration. Idiosyncratic events, like a heritage overlay or a contaminated site, rarely show up in training data at all. Bias creeps in when historical sales skew toward affluent, well-documented suburbs.
Statistic callout: BCG’s research on AI-first real estate companies found that firms embedding AI into underwriting and portfolio decisions report measurable improvements in IRR and sharper asset selection, though adoption maturity still varies widely across the sector.
- Strength: fast, multi-signal suburb ranking and early trend detection.
- Weakness: unreliable in thin, small-population markets.
- Weakness: blind to one-off property or planning issues without human input.
A practical workflow for using AI forecasts in investment decisions
Getting a usable forecast out of an AI tool starts well before you type a question into it. The output is only as good as what you feed it, and vague inputs produce vague, unusable numbers.
- Prepare asset-level data. Gather accurate unit rents, capex schedules, and lease roll dates rather than relying on suburb averages.
- Configure the model properly. Force it to output unit-level rent schedules, stated assumptions, and a range of scenarios rather than one headline figure, since good prompting and accurate inputs are essential to getting an underwritable projection.
- Run scenario stress tests. Shift the exit cap rate, shock the interest rate, and test a vacancy blowout to see how fragile the return really is.
- Verify with humans on the ground. Cross-check against a local agent’s read, planning and consent records, and ideally a physical inspection.
Pro Tip: Never accept a single-point forecast. Ask the model to show its assumptions line by line, then rerun the scenario with your own more conservative numbers.
How to read model outputs and validation metrics
Three metrics tell you whether a valuation model is trustworthy: mean absolute error (MAE), root mean squared error (RMSE), and R². MAE gives you the average dollar or percentage error; RMSE penalises big misses harder; R² tells you how much of the price variation the model actually explains. A model claiming under 3% MAE in a major city sounds impressive, and next-generation automated valuation models in large Australian cities are approaching that range when they combine live auction data with imagery. That still doesn’t remove execution risk on your specific deal.
- Ask whether the model was tested out-of-sample, not just fitted to historical data it already knew.
- Walk-forward validation (testing on data the model has never seen, in time order) is the gold standard.
- Statistic callout: A small shift in exit cap rate, say 25 to 50 basis points, can swing a five-year IRR by several percentage points, which is exactly why exit-cap sensitivity belongs in every AI-assisted analysis.
Managing bias and governance risk in AI property forecasts
The most common bias comes from training data skewed toward affluent, transaction-rich suburbs, which quietly under-predicts returns in less-documented areas. Construction and permitting delays often get omitted entirely, and survivorship bias creeps in when a dataset only captures properties that sold rather than the ones that sat unsold for months.
Mitigation is manageable if you build it into the process. Recalibrate models against local data rather than trusting national averages. Run more than one model and compare their outputs, an ensemble-of-models approach that combining macro, legal, and micro signals into an auditable risk score can strengthen further. Insist on human sign-off before any decision, and keep a documented, version-controlled record of what assumptions went into each forecast.
- Recalibrate locally rather than trusting a national model.
- Run multiple models and compare outputs before you trust any single number.
- Require a documented explainability report before relying on a forecast for a live decision.
How Wealthstacker applies AI forecasting to real portfolios
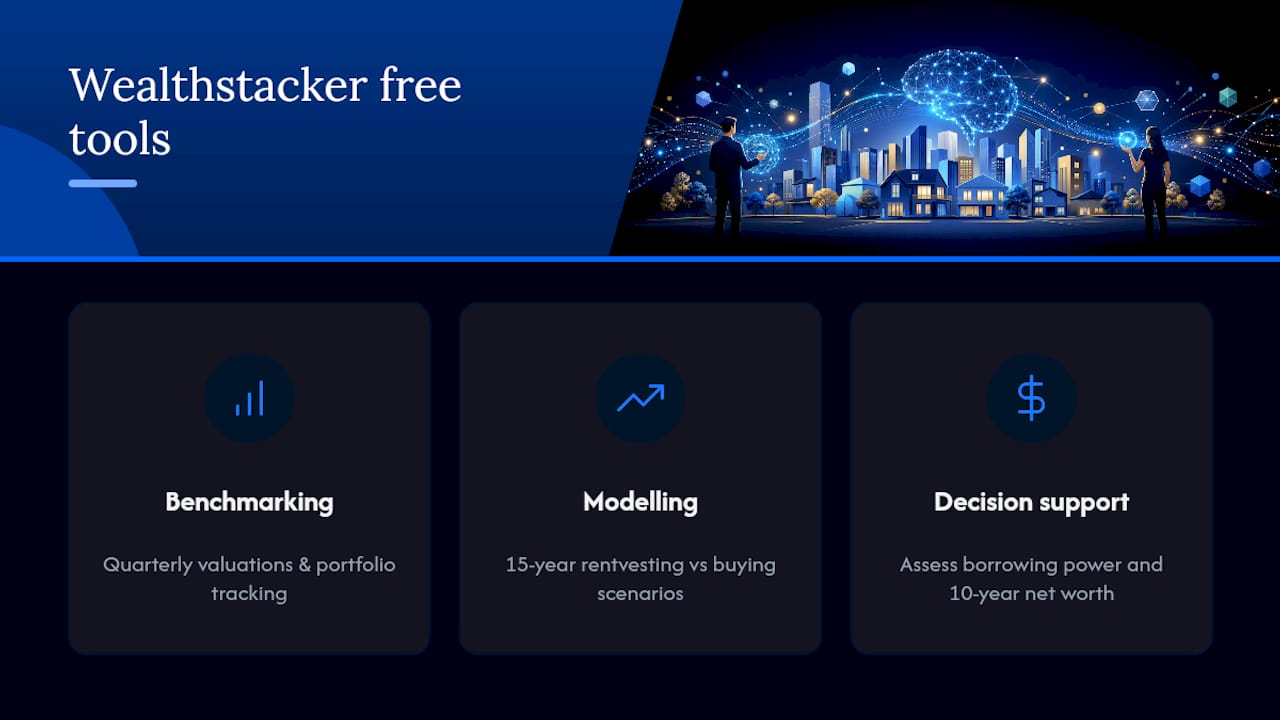
Wealthstacker builds automated quarterly property valuations at no cost, giving investors and renters a running read on market movement without needing to commission a formal appraisal every few months. The platform layers personalised modelling on top of that: a rentvesting-versus-buying comparison, a 15-year wealth accumulation forecast, and a borrowing-power estimate that adjusts as your inputs change.
The same verification discipline that applies to any AI forecast applies here. Before leaning on a projection, check the assumptions the model used, run an alternate exit-cap scenario, and look for an explanation of which inputs are driving the number.
- Automated quarterly valuations, updated without manual requests or fees.
- 15-year scenario modelling for comparing rentvesting against buying outright.
- Borrowing-power estimates tied to your actual financial inputs, not a generic benchmark.
A checklist before you trust an AI property forecast
Run through this before letting any AI output influence a purchase or sale decision.
- Confirm the data behind the forecast is current, not stale by a quarter or more.
- Check whether the model has been recalibrated for your specific local market.
- Ask for backtest results. No backtest means no evidence the model works.
- Stress test the forecast against exit-cap and interest-rate shocks.
- Get a human to sign off before you act on the number.
Red flags include a single-source prediction with no range, no visible backtest, or driver importance that nobody can explain. If you hit any of these, bring in a local valuer, widen your stress ranges, or simply wait.
Try Wealthstacker’s free quarterly valuations and scenario tools
Testing an AI forecast against your own numbers is the fastest way to see whether it holds up. Wealthstacker’s automated quarterly property valuations and portfolio tracking give you a free, ongoing benchmark to compare against any other tool you’re using, and the platform’s 15-year modelling lets you run your own rentvesting-versus-buying scenarios before you commit to either path. If you’re weighing borrowing power or trying to map out where your net worth lands in a decade, start with the Wealthstacker property investment platform and run the numbers on your own situation.
Sources
For readers who want to check the claims above directly, these are the sources worth reading in full: CBRE’s analysis on AI and real estate forecasting, BCG’s executive perspective on AI-first real estate firms, and the MDPI study on machine learning valuation performance. For a practitioner’s view on prompting and inputs, see RealData’s guide to AI in investment analysis, and for broader industry commentary, ClosersLeague’s piece on AI in real estate investing.
- Artificial Intelligence and real estate market forecasting | CBRE
- AI-first companies: real estate executive perspectives | BCG
- A practical guide to using AI for real estate investment analysis | RealData