
Rent to Income Ratio in Australia: How to Work Out Yours
Your rent to income ratio is the share of your income that goes on rent. Divide a year of rent by a year of income and multiply by 100. In Australia, 30% is the usual line: above it, a household is generally considered to be under rental stress. Below it, rent is usually seen as manageable. The catch is that “income” can mean before tax or after tax, and the answer changes a lot depending on which you use. This guide covers both, with worked examples, the official definitions, what the national data shows, and how to use the number whether you rent, rentvest or invest.
WealthstackerSee How Rent Fits Your Wealth PlanWealthStacker helps you compare rentvesting and buying strategies with personalized modeling and real-time net worth insights.Explore WealthStackerTL;DR
- The formula: annual rent ÷ annual income × 100. Use 52 weeks, 26 fortnights or 12 months to annualise your rent.
- The benchmark: official Australian measures flag more than 30% of gross (pre-tax) income as the point of stress. Many personal finance guides suggest aiming for about 25% of take-home pay.
- The reality: rental households were spending an average of 33.4% of pre-tax income on rent, the highest level on record in Cotality’s analysis.
- The limit: the ratio is a screening tool. It ignores your other costs, your location and your goals, so pair it with a wealth model.
Table of Contents
- How to calculate your rent to income ratio
- Before tax or after tax: which income should you use?
- What counts as rental stress in Australia?
- Where Australian renters actually sit
- What the ratio can and cannot tell you
- How to bring your ratio down
- If you are an investor, the ratio works differently
- Renting, rentvesting or buying: where the ratio fits
- Model your rent, not just measure it
- FAQ
- Sources
How to calculate your rent to income ratio
The calculation takes three steps.
- Annualise your rent. Weekly rent × 52, fortnightly rent × 26, or monthly rent × 12. Using 52 weeks (not 4 weeks a month) keeps the maths honest.
- Annualise your income. Use the same period and the same basis for every household member whose income you are counting.
- Divide and multiply by 100. Annual rent ÷ annual income × 100.
A worked example
Say you pay $600 a week and your household earns $90,000 a year before tax.
- Annual rent: $600 × 52 = $31,200
- Ratio on gross income: $31,200 ÷ $90,000 × 100 = 34.7%
The same $600 a week is $1,200 a fortnight (× 26) or $2,600 a month (× 12). All three give $31,200, so you land on the same ratio whichever way your lease is written.
Now suppose your take-home pay is $72,000 a year. On that basis the ratio is $31,200 ÷ $72,000 × 100 = 43.3%. Same rent, same household, a very different number. That is why you need to know which version a benchmark is using before you compare yourself to it.
Working backwards: what rent can you afford?
If you want a rent ceiling rather than a ratio, flip the formula.
| Basis | Income | Target share | Annual rent | Weekly rent |
|---|---|---|---|---|
| Gross (pre-tax) | $90,000 | 30% | $27,000 | about $519 |
| Net (take-home) | $72,000 | 30% | $21,600 | about $415 |
| Net (take-home) | $72,000 | 25% | $18,000 | about $346 |
The gap between the first and last rows is nearly $175 a week. It shows why the basis matters as much as the percentage.
Before tax or after tax: which income should you use?
Both are used, for different purposes.
Official measures use gross income. The Australian Institute of Health and Welfare explains that housing costs to gross household income is expressed as a percentage of total income before taxes and other deductions, such as the Medicare levy. It also reports a disposable-income version, which deducts estimated taxes. The ABS Census Rent Affordability Indicator groups renting households by whether rent is 30% or less of household income, or more than 30%.
Personal guidance often uses take-home pay. Savings.com.au suggests individual renters measure rent against net income, aim for around 25% and ideally stay under 30%. That is a stricter test for you, because net income is smaller than gross.
A practical way to use both:
- Use gross when you want to compare yourself with official statistics and news headlines.
- Use net when you are setting your own budget, because it reflects the money that actually lands in your account.
- Run both. If you are under 30% on gross but over 30% on net, expect rent to squeeze your other goals.
What counts as rental stress in Australia?
The 30% line is built into how Australian researchers and governments talk about affordability, but the definitions are not all identical.
The 30% of gross income rule
The AIHW says housing stress is most often used to describe lower-income households spending more than 30% of gross income on housing costs. Housing costs there include rent, water and general rates, and mortgage payments for owners. For Commonwealth Rent Assistance recipients, the AIHW defines rental stress as spending more than 30% of gross income on rent after CRA is deducted. Its quarterly data shows around 44% of CRA income units remain in rental stress even after receiving the payment.
The 30/40 indicator
Housing researchers often use the 30:40 measure. AHURI explains that it flags a household when its income is in the bottom 40% of the distribution and it pays more than 30% of income on housing costs. That is why a household on a high income can pay more than 30% and still fall outside the formal definition of housing stress. AHURI is also clear that this is an indirect gauge for a target group, not a scientific measure or a guide to affordability across the whole housing market.

The Rental Affordability Index
The Rental Affordability Index from SGS Economics and Planning gives a finer scale. In its 2021 edition, a score above 150 means rent is below 15% of income, 100 to 120 is moderately unaffordable (25 to 30%), and below 50 is extremely unaffordable (60% or more). Think of it as a way to see that 31% and 55% are both “over the line” but very different experiences.
A quick reference
| Your ratio | What it generally signals |
|---|---|
| Under 25% of net income | Comfortable by most personal finance guidance |
| 25% to 30% | Manageable, with less room for shocks |
| Over 30% of gross income | Meets the common definition of rental stress |
| 38% or more | Unaffordable to severely unaffordable on the RAI scale |
| 60% or more | Extremely unaffordable on the RAI scale |
Where Australian renters actually sit
If your ratio is above 30%, you are in large company.
- Record national level. Cotality’s analysis, reported by SBS in February 2026, found national rents rose 43.9% in the five years to September 2025, while wages grew 17.5%. Rental households were spending an average of 33.4% of pre-tax income on rent, against a decade average of 29.2%. The recent low was 26.2% in the September quarter of 2020.
- New leases. The ANZ CoreLogic report found the share of median income needed to service median new rents hit a series high of 32.2% in March 2024, with the 25th percentile ratio at a record 54.3%. Lower-priced rentals take a far bigger bite.
- Low-income households. In 2024-25, the AIHW estimated 1.26 million low-income households were in financial housing stress. One in five (20.5%) households in the rental market were affected, compared with 14.7% of owners with a mortgage.
- Survey view. Mozo’s 2024 Rental Report, based on a survey of 2,554 Australians, found roughly half of renters spend 30% or more of their income on rent, and 1 in 10 spend 60% or more.
- By location. SGS’s 2025 Rental Affordability Index found that in the least affordable areas, including Perth, Sydney, regional Queensland and regional New South Wales, even average earners are pushed into rental stress. The average renting household in Sydney was spending exactly 30% of its income on rent.
The ABS notes that the Survey of Income and Housing, run every two years, is the most accurate source for counting households that spend more than a set share of income on housing. That is where to look for the most reliable national figures.
The outlook matters if you are planning ahead. Cotality’s Eliza Owen-style commentary is not needed here; its head of research Tim Lawless said that, with vacancy rates near record lows in many markets and completions below what population growth needs, it is hard to see rents easing materially soon. For more on where rents may head, see our look at forecast rental growth in Australia.

What the ratio can and cannot tell you
The ratio is popular because it is simple. AHURI points out its strengths: it uses few variables, its logic is easy to explain to non-experts, and it has been used long enough to show trends over time. That makes it a good first check.
It works best as a starting point, because it leaves out:
- Other costs. Transport, childcare, HECS-HELP repayments and utilities differ hugely between households on the same income.
- Household shape. Two people sharing at $600 a week face a different test from one person paying the same rent alone.
- What you do with the gap. A renter at 35% who invests the difference between renting and owning may be building wealth. A renter at 25% with no plan may not be.
- Location trade-offs. Paying more to live closer to work can cut commuting costs and lift earning power.
So use the ratio to decide whether rent is a problem, then use a model to decide what to do about it.
How to bring your ratio down
If you are above your target, the levers are limited but real.
- Check which basis you are on. Recalculate with gross and net income so you know how far over you actually are.
- Add household income. A second income changes the ratio quickly. Use combined annual figures for both rent and income.
- Compare nearby suburbs. Rent can vary a lot within a short commute. Put each option through the same formula.
- Check your eligibility for support. If you receive an income support payment, ask Services Australia whether you qualify for Commonwealth Rent Assistance.
- Plan for renewals. Work out your ratio at a rent 5% and 10% higher, so a lease renewal does not catch you out.
If your ratio is persistently high and you are struggling to cover essentials, a free financial counsellor through the National Debt Helpline (1800 007 007) can help you work through your budget.
If you are an investor, the ratio works differently
Landlords use the same logic from the other side. Property managers assess whether an applicant’s income supports the rent, and the IPB property management guide says rent is typically assessed at under 30 to 35% of net earnings. For an investor, that means a rent set well above what local tenants can afford is likely to face longer vacancies or turnover.
But the ratio does not measure your return. That is the job of yield and cash flow:
- Gross rental yield is annual rent divided by the property’s value, times 100. Our guide to gross rental yield walks through it.
- Net yield and cash flow subtract holding costs such as rates, insurance, management fees and maintenance, then factor in loan repayments. Read why rental yield matters to property investors for the full picture.
- Price to rent ratio compares what a property costs to buy against what it costs to rent. See how to calculate the price to rent ratio.
A simple way to hold them together: rent to income tells you whether tenants can afford the rent, yield tells you what the rent earns against the price, and cash flow tells you what is left after the bills.
Renting, rentvesting or buying: where the ratio fits
For many Australians the real question behind the ratio is whether to keep renting, buy where they live, or rent where they want to live and invest elsewhere. That last approach is called rentvesting.
Your rent to income ratio is the first input. It shows how much room you have to save a deposit while paying rent. If rent already uses a third or more of your pre-tax income, saving at pace is harder, and the plan has to account for that. From there, the useful comparisons are:
- How your net worth could look over time if you rent and invest versus buy. Our renting vs buying wealth comparison sets out the logic.
- How a deposit plan works under lender serviceability rules, covered in our rentvesting deposit strategy.
- What can go wrong, in rentvesting risks to check before you buy.
- How to build the numbers yourself, in our renter financial modelling guide.
Model your rent, not just measure it
A single ratio is a snapshot. WealthStacker is built to turn it into a plan. Our toolkit offers free automated quarterly property valuations, 15-year modelling that compares rentvesting and buying scenarios, interactive goal and net worth planners, borrowing power estimates and market research tools for Australian suburbs. It is designed so you do not need a spreadsheet to see how your rent, income and savings could play out.
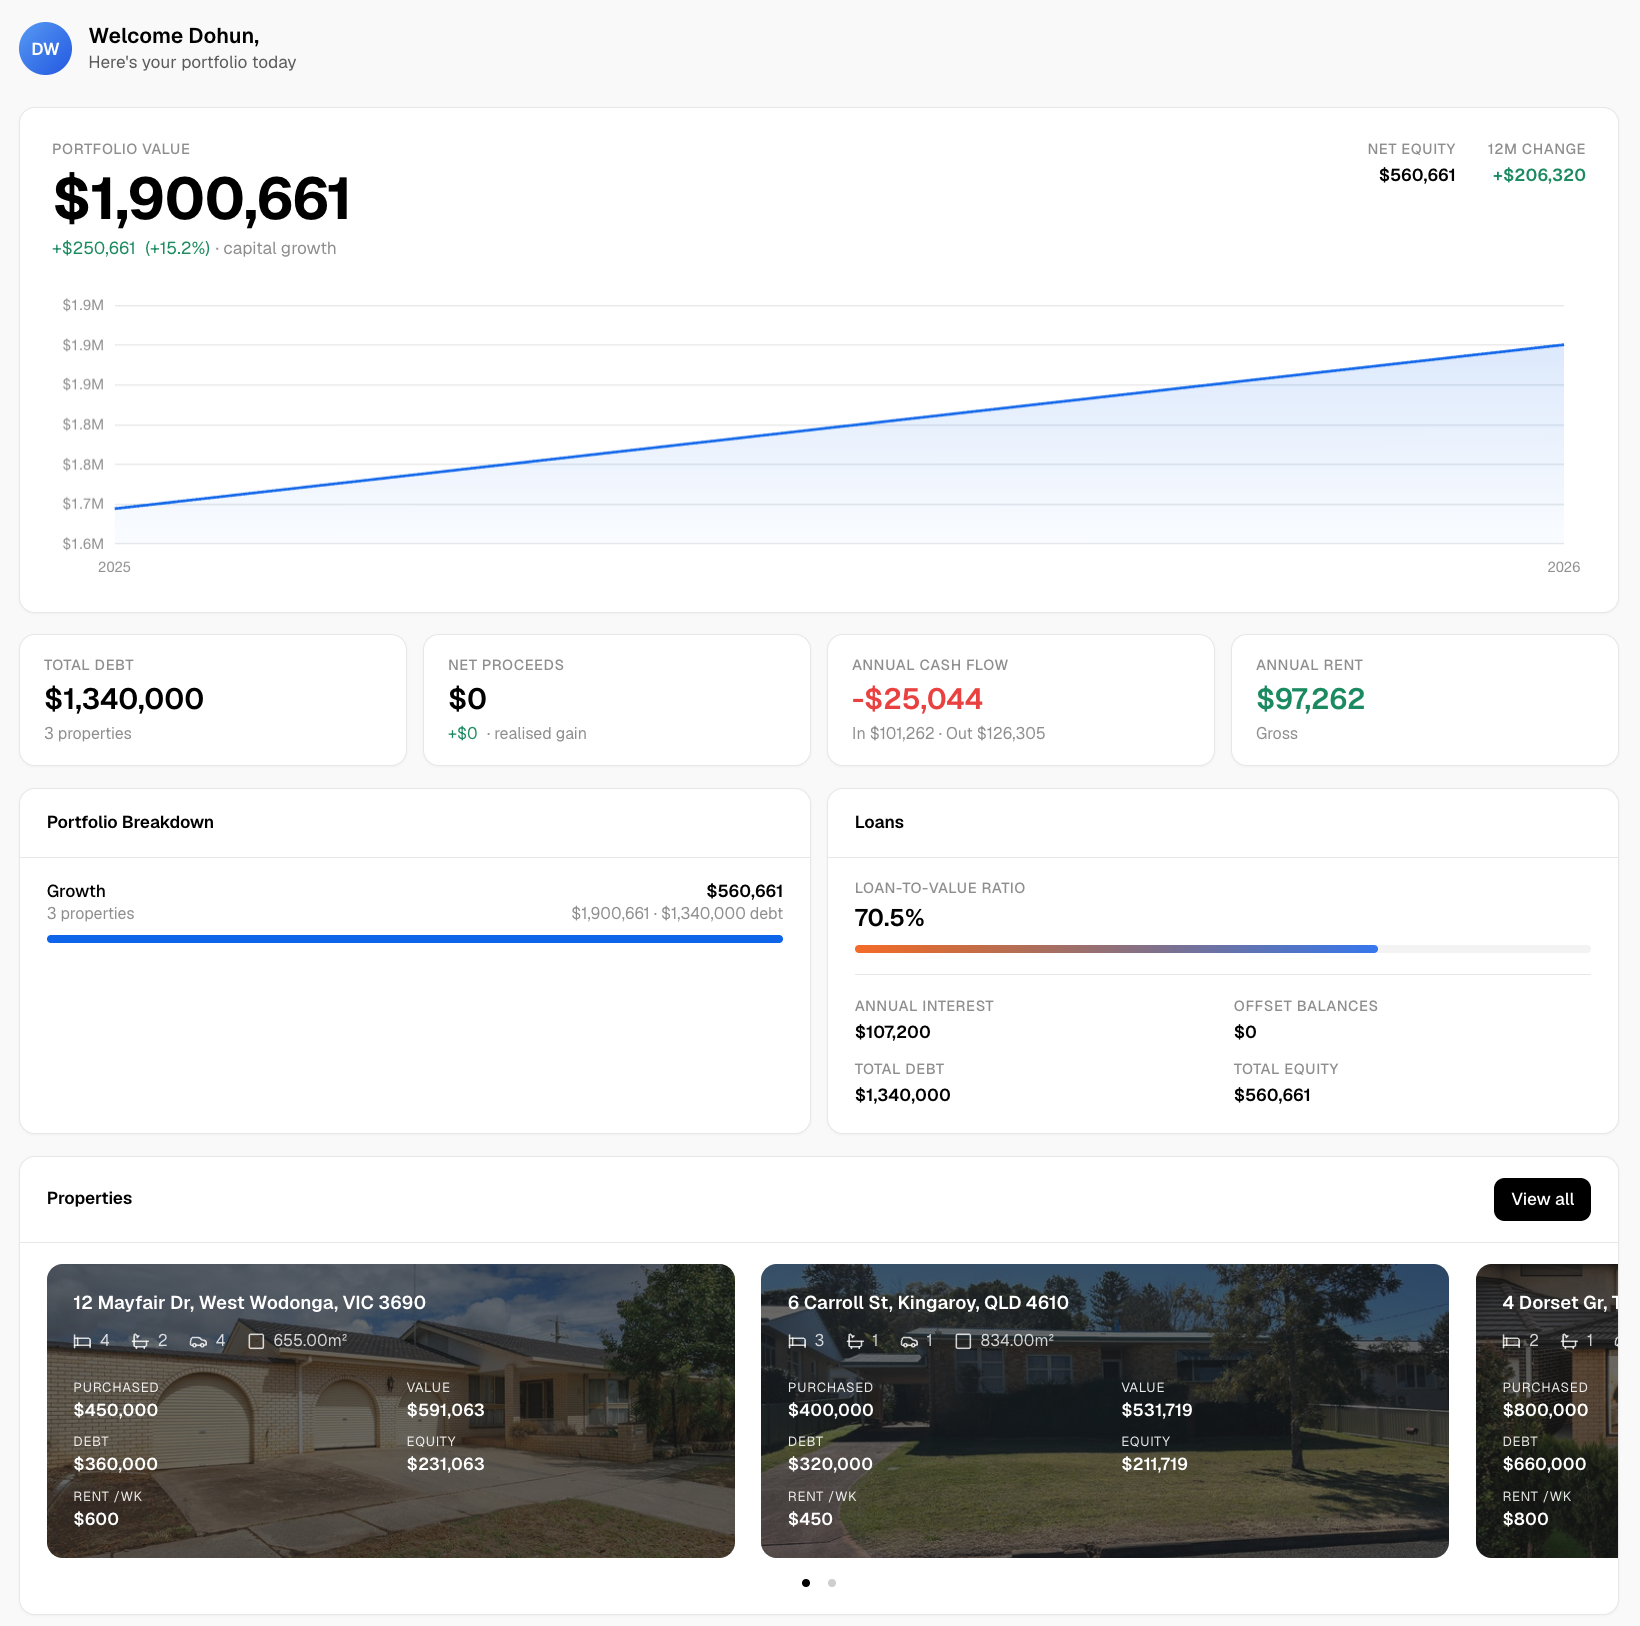
If your ratio is telling you rent is heavy and you want to see what the alternatives could look like, start with the WealthStacker toolkit or see the features overview. You can also browse more guides on the WealthStacker blog.
FAQ
What is a good rent to income ratio in Australia?
Most personal finance guidance points to around 25% of take-home pay, and ideally no more than 30%. Official measures treat more than 30% of gross income as the point of rental stress. Because gross income is larger than net, 30% of gross is a looser test than 30% of net.
Should I use gross or net income to calculate it?
Use gross income to compare yourself with official statistics, which are generally expressed that way. Use net income for your own budget, since it reflects what you actually have to spend. Running both gives you a range rather than a single answer.
Is 40% of income on rent too much?
It is above the 30% line used in Australian definitions of rental stress, and on the Rental Affordability Index it falls in the “severely unaffordable” range (38 to 60% of income). Many renters are there: Mozo’s survey found about half of renters spend 30% or more. If you are at 40%, review your budget and whether household income or location can change.
Is the rent to income ratio the same as rental yield?
No. Rent to income compares rent with a household’s earnings and is about affordability for the tenant. Rental yield compares rent with a property’s value and is about return for the investor. Investors often look at both, along with cash flow.
Does the 30% rule apply to everyone?
It is a guide, not a rule. The formal 30:40 measure applies to households in the bottom 40% of the income distribution. A higher earner can pay more than 30% and still manage comfortably, while a lower-income household may struggle well below it.
Sources
- AIHW: Housing affordability
- ABS: Rent affordability indicator (RAID)
- ABS: Guide to housing affordability statistics
- AIHW: Commonwealth Rent Assistance in Australia, quarterly data
- AHURI: Understanding the 30:40 indicator of housing affordability stress
- Rental Affordability Index 2021 (SGS Economics and Planning)
- SGS Economics and Planning: Rental Affordability Index 2025
- SBS News: Cotality rent and income analysis
- ANZ CoreLogic Housing Affordability Report, April 2024
- Mozo Rental Report 2024
- Savings.com.au: Rent to income ratio
- IPB: Guide to property management