
Real estate ROI benchmarks explained: what investors need to know
Total pre-tax ROI across a typical multi-year hold, combining rental income and capital growth, tends to reach a moderate single-digit annual range for well-selected properties in major markets.
The metric you reach for first depends on your goal. Use gross yield for a quick suburb screen. Switch to net yield and cash-on-cash return the moment you are comparing real costs. Use total ROI or CAGR to judge whether a property actually built wealth over time.
Here is what the sections below cover:
- Key ROI metrics and when to use each one
- Step-by-step formulas and a worked numeric example
- Australia-specific benchmark ranges by city and property type
- Taxes, loan costs, vacancy, depreciation and APRA’s serviceability buffer
- A practical checklist for evaluating any property
Key takeaways
Australian property ROI benchmarks only tell the full story when gross yield, net yield, and cash-on-cash return are read together, modelled at the APRA-assessed rate, and tested against at least three capital growth scenarios.
| Point | Details |
|---|---|
| Gross yield is a screen, not a verdict | Use it to filter suburbs quickly; switch to net yield and cash-on-cash for real decisions. |
| APRA’s 3% buffer changes the numbers | Model interest at loan rate + 3 percentage points to reflect what lenders actually assess. |
| City context matters | National gross yield averages 3.57%; Sydney sits at around 3% while Darwin reaches above 6%. |
| Run three growth scenarios | Test conservative (~2.5–3.5%), base (~4–5%), and optimistic (~6–7%) capital growth rates. |
| Exit costs reduce total ROI | Selling costs of 2–3% and CGT can materially reduce the final return figure. |
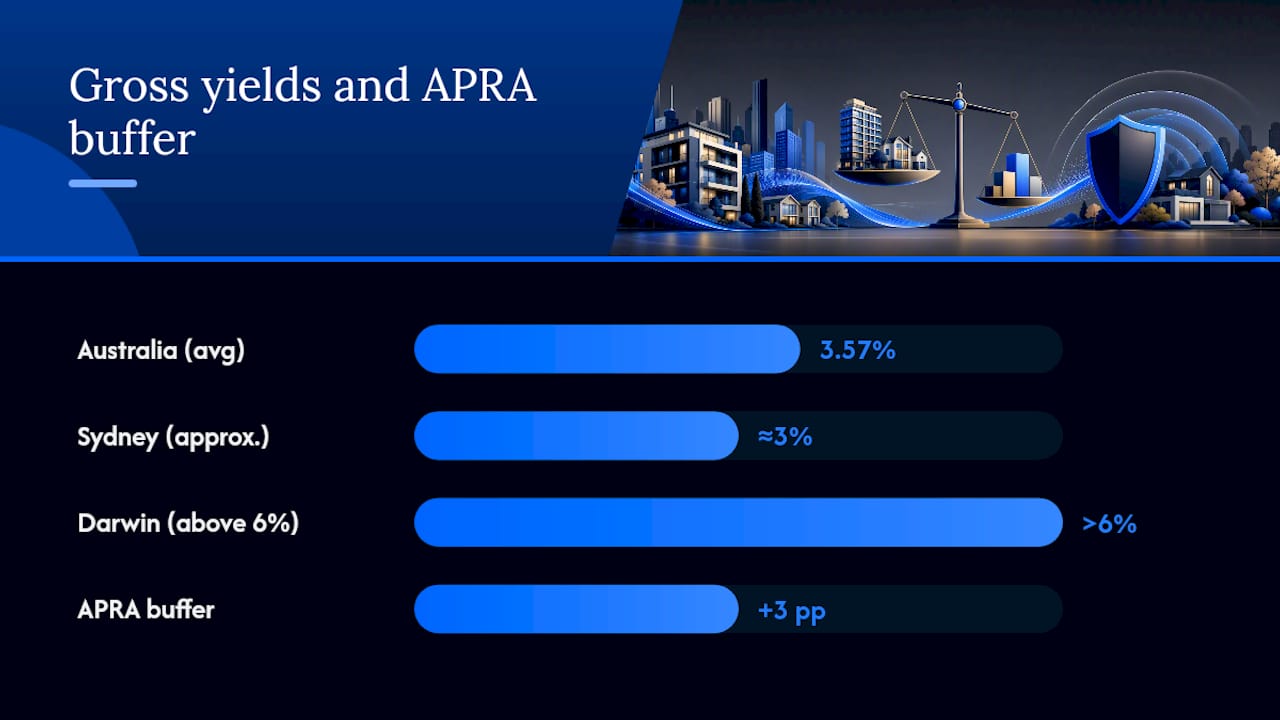
Table of Contents
- What are the key ROI metrics for real estate?
- How do you calculate real estate ROI?
- What are the real estate ROI benchmarks for Australian cities?
- What changes your headline ROI? Taxes, loans, vacancy and APRA
- A practical checklist for evaluating any property
- How Wealthstacker speeds up benchmarking and stress testing
- Sources
What are the key ROI metrics for real estate?
Understanding real estate ROI starts with knowing which number answers which question. There are six metrics worth knowing, and they are not interchangeable.
Gross rental yield is annual rent divided by purchase price, expressed as a percentage. It is the fastest screen you can run on a suburb or property type. It tells you nothing about costs, but it lets you filter out obvious mismatches in seconds.
Net rental yield subtracts all operating costs (management fees, council rates, insurance, maintenance, strata) from annual rent before dividing by purchase price. This is the number that tells you whether a property actually generates income after the bills are paid.
Cash-on-cash return goes one step further. It measures the annual pre-tax cash flow against the actual cash you invested, meaning your deposit, stamp duty, and acquisition costs. This is the metric lenders and experienced investors watch most closely.
Net operating income (NOI) is the annual rental income minus all operating expenses, before financing costs. It is used mainly in commercial property analysis and as an input to cap rate.
Cap rate (capitalisation rate) divides NOI by the property’s market value. It is standard in commercial real estate and useful for comparing assets independent of how they are financed. In residential property, it is less commonly cited but worth knowing when you are comparing a residential block against a commercial alternative.
Total ROI and CAGR capture the full picture: capital growth plus net rental income over the holding period, expressed as a percentage of total cash invested. CAGR (compound annual growth rate) annualises that total return so you can compare a 5-year hold against a 10-year one on equal terms. IRR (internal rate of return) is the most precise version of this, accounting for the timing of each cash flow, though it requires a spreadsheet to calculate properly.
Statistic callout: Lenders typically shade rental income to around 80% of gross rent for serviceability assessments, with some applying additional caps based on property value. That gap between your modelled rent and the rent a lender will count can materially change your borrowing capacity.
The pre-tax versus after-tax distinction matters here too. Gross and net yields are pre-tax figures. Cash-on-cash and total ROI can be calculated either way, but comparing them across properties only makes sense if you use the same basis. Most portfolio performance metrics guides recommend starting with pre-tax figures for comparison, then applying your marginal tax rate to model the real outcome.
Pro Tip: Use gross yield to screen suburbs, net yield to compare shortlisted properties, and cash-on-cash to decide whether a specific deal works at your deposit size and loan rate.

How do you calculate real estate ROI?
The formulas are straightforward. The discipline is including every cost.
The core formulas
Gross rental yield:
(Annual rent ÷ Purchase price) × 100
Net rental yield:
((Annual rent − Annual operating costs) ÷ Purchase price) × 100
Cash-on-cash return:
(Annual pre-tax cash flow ÷ Total cash invested) × 100
where Annual pre-tax cash flow = Annual rent − Operating costs − Annual mortgage interest
and Total cash invested = Deposit + Stamp duty + Legal fees + Inspection costs
Total ROI:
((Net rental income over hold + Capital gain − Selling costs) ÷ Total cash invested) × 100
CAGR (annualised total return):
((Final value ÷ Initial cash invested) ^ (1 ÷ Years held) − 1) × 100
In Excel or Google Sheets, CAGR is: =((End_Value/Start_Value)^(1/Years))-1
Worked example
A property purchased for $700,000 in Brisbane, held for seven years, then sold.
That CAGR looks strong, but notice the annual cash flow is negative $13,270. This property is negatively geared, which means you are funding the shortfall from other income each year in exchange for capital growth. A complete ROI calculation should always include rental income, operating expenses, loan repayments, tax effects, capital growth, and sale costs together.
Cost items to include in every net calculation
- Upfront: stamp duty, legal/conveyancing fees, building and pest inspection, loan establishment fees, lenders mortgage insurance (if applicable)
- Ongoing: property management fees, council rates, water rates, strata/body corporate levies, landlord insurance, maintenance and repairs, vacancy allowance (typically 2–4 weeks per year)
- Exit: agent commission, legal fees, capital gains tax (CGT) on the taxable portion
Annual interest climbs to approximately $51,520, pushing the annual cash shortfall to around $30,070. That changes the conversation about whether the deposit is sufficient.
What are the real estate ROI benchmarks for Australian cities?
Cotality/CoreLogic-derived data from March 2026 puts the national combined gross yield at around 3.57%, with units running roughly 1–1.5 percentage points above houses nationally. City-level figures vary considerably.
| City | Gross yield (approx.) | Notes |
|---|---|---|
| Sydney | around 3% | Lowest yield, highest median price; capital growth historically strong |
| Melbourne | around 3% | Moderate yield; unit oversupply in some inner suburbs |
| Brisbane | around 4% | Strong yield growth post-pandemic; solid capital growth |
| Adelaide | ~4.5% | Tight vacancy; consistent rental demand |
| Perth | around 5% | High yield driven by resource-sector demand cycles |
| Hobart | around 4% | Small market; yields improved as prices moderated |
| Darwin | above 6% | Highest gross yield nationally; volatile capital growth |
| Canberra | around 4% | Stable government-sector demand; moderate yields |
Sources: Cotality/CoreLogic via Mortgage World Australia, March 2026.
Houses versus units
Houses typically yield less than units in the same suburb, often by 1–1.5 percentage points, because land value drives the purchase price up without a proportional rent increase. Units tend to offer stronger cash flow but historically weaker capital growth.
SQM Research reported a national vacancy rate of 1.3% in June 2026, with asking rents up around 8.1% year-on-year. Rental markets remained exceptionally tight despite a small rise in vacancies, which supports conservative vacancy assumptions in most capital city models.
Regional markets and the US “1% rule”
Benchmark your expectations against Australian city data, not US rules of thumb.
- Strong gross yield for a capital city: 4.5–6%
- Acceptable gross yield for a capital city: 3–4.5%
- Poor gross yield for any market: below 3%
- Exceptional gross yield (usually regional or high-risk): above 6%
What changes your headline ROI? Taxes, loans, vacancy and APRA
Headline gross yield is a starting point, not a result. Several factors can move it sharply in either direction.
Items that adjust headline ROI to investor ROI
- Mortgage interest: the single largest cost for most leveraged investors; a 1% rate rise on a $560,000 loan adds $5,600 per year to outgoings
- Principal repayments: not a cash-flow cost in the ROI sense (they build equity), but they affect liquidity
- Negative gearing: the shortfall between rental income and deductible costs reduces taxable income; the tax saving partially offsets the cash shortfall, but the property still requires ongoing funding
- Depreciation: a non-cash deduction on building structure and fittings that reduces taxable income without affecting cash flow; a quantity surveyor’s report is required to claim it
- Land tax: applies once your total landholding exceeds state-specific thresholds; rates and thresholds vary by state
- Vacancy: even 2 weeks of vacancy per year reduces effective annual rent by roughly 3.8%
- Selling costs: agent commission plus legal fees typically run 2–3% of sale price; excluding them overstates total ROI
APRA’s serviceability buffer and what it means for your model
APRA requires lenders to stress-test borrower affordability at a minimum of 3 percentage points above the loan rate. This is not a theoretical exercise. It directly limits how much you can borrow, which changes your deposit requirement and therefore your cash-on-cash return.
A quick illustration using the worked example above:
The buffer reduces borrowing capacity, which means a larger deposit is required to purchase the same property. That larger cash outlay reduces your cash-on-cash return even before the higher stress-test rate is applied to the loan itself. For rentvesting scenarios, this effect can be decisive. See the rentvesting vs buying guide for a fuller treatment of how borrowing structure affects effective ROI.
Lenders also shade rental income, typically counting around 80% of gross rent for serviceability. On a property earning $28,600 per year, the lender counts roughly $22,880. Some lenders apply an additional cap based on property value, which can further reduce the rental income counted on high-yield regional properties.
If the deal only works at the advertised rate, it will not survive a lender’s serviceability assessment.*
Tax and depreciation outcomes vary significantly by individual circumstances. Consult a licensed financial adviser or tax professional for personalised modelling.
A practical checklist for evaluating any property
Run these steps in order before committing to any property. The property investment checklist for beginners covers the broader due diligence process; this checklist focuses specifically on ROI benchmarking.
-
Quick gross yield screen. Calculate annual rent divided by asking price. If the result is below 3% in a capital city with no exceptional growth story, move on unless you have a specific capital growth thesis.
-
Build the net yield. Subtract management fees, council rates, insurance, strata, and a maintenance allowance. If net yield drops below 2.5%, the property needs very strong capital growth to justify the holding costs.
-
Calculate cash-on-cash at the APRA-assessed rate. Use loan rate + 3% for interest. Include your actual deposit, stamp duty, and acquisition costs as the denominator. A negative result is not automatically disqualifying, but quantify exactly how much you need to fund each year.
-
Run at least three capital growth scenarios. Use conservative (~2.5–3.5% p.a.), base (~4–5% p.a.), and optimistic (~6–7% p.a.) growth rates. Calculate total ROI and CAGR for each. Running multiple growth scenarios is standard practice for any serious ROI analysis.
-
Model a vacancy and rate-rise stress test. Increase vacancy to 6 weeks per year and raise the interest rate by 3 percentage points. If the property becomes unserviceable under this scenario, your buffer is too thin.
-
Check tax and exit costs. Estimate CGT on the expected gain (using your marginal rate on 50% of the gain if held more than 12 months), add selling costs of 2–3%, and recalculate total ROI. Many investors are surprised how much this reduces the final figure.
-
Assess strategy fit. A property that passes every benchmark screen may still be wrong for your situation if it ties up liquidity you need, requires active management you cannot provide, or sits in a market you cannot monitor.
Red flags to watch for
- Gross yield below 3% combined with negative cash flow and a loan-to-value ratio above 80%
- Gross yield above 7% in a regional market with a single employer or industry driving demand
- Less than 1% margin between your modelled interest rate and the APRA stress-test rate
- Vacancy rates in the suburb above 3% (well above the national 1.3% figure from SQM Research)
How Wealthstacker speeds up benchmarking and stress testing
Running the calculations above manually for every property you consider is time-consuming and error-prone. A dedicated investment toolkit reduces both problems.
Wealthstacker provides:
- Automated quarterly property valuations at no cost, so your portfolio figures stay current without manual research
- 15-year scenario modelling that lets you compare rentvesting and buying strategies side by side, with adjustable growth rates and interest rate inputs
- Borrowing power estimations that incorporate lender shading and serviceability buffers, so your models reflect what a lender will actually approve
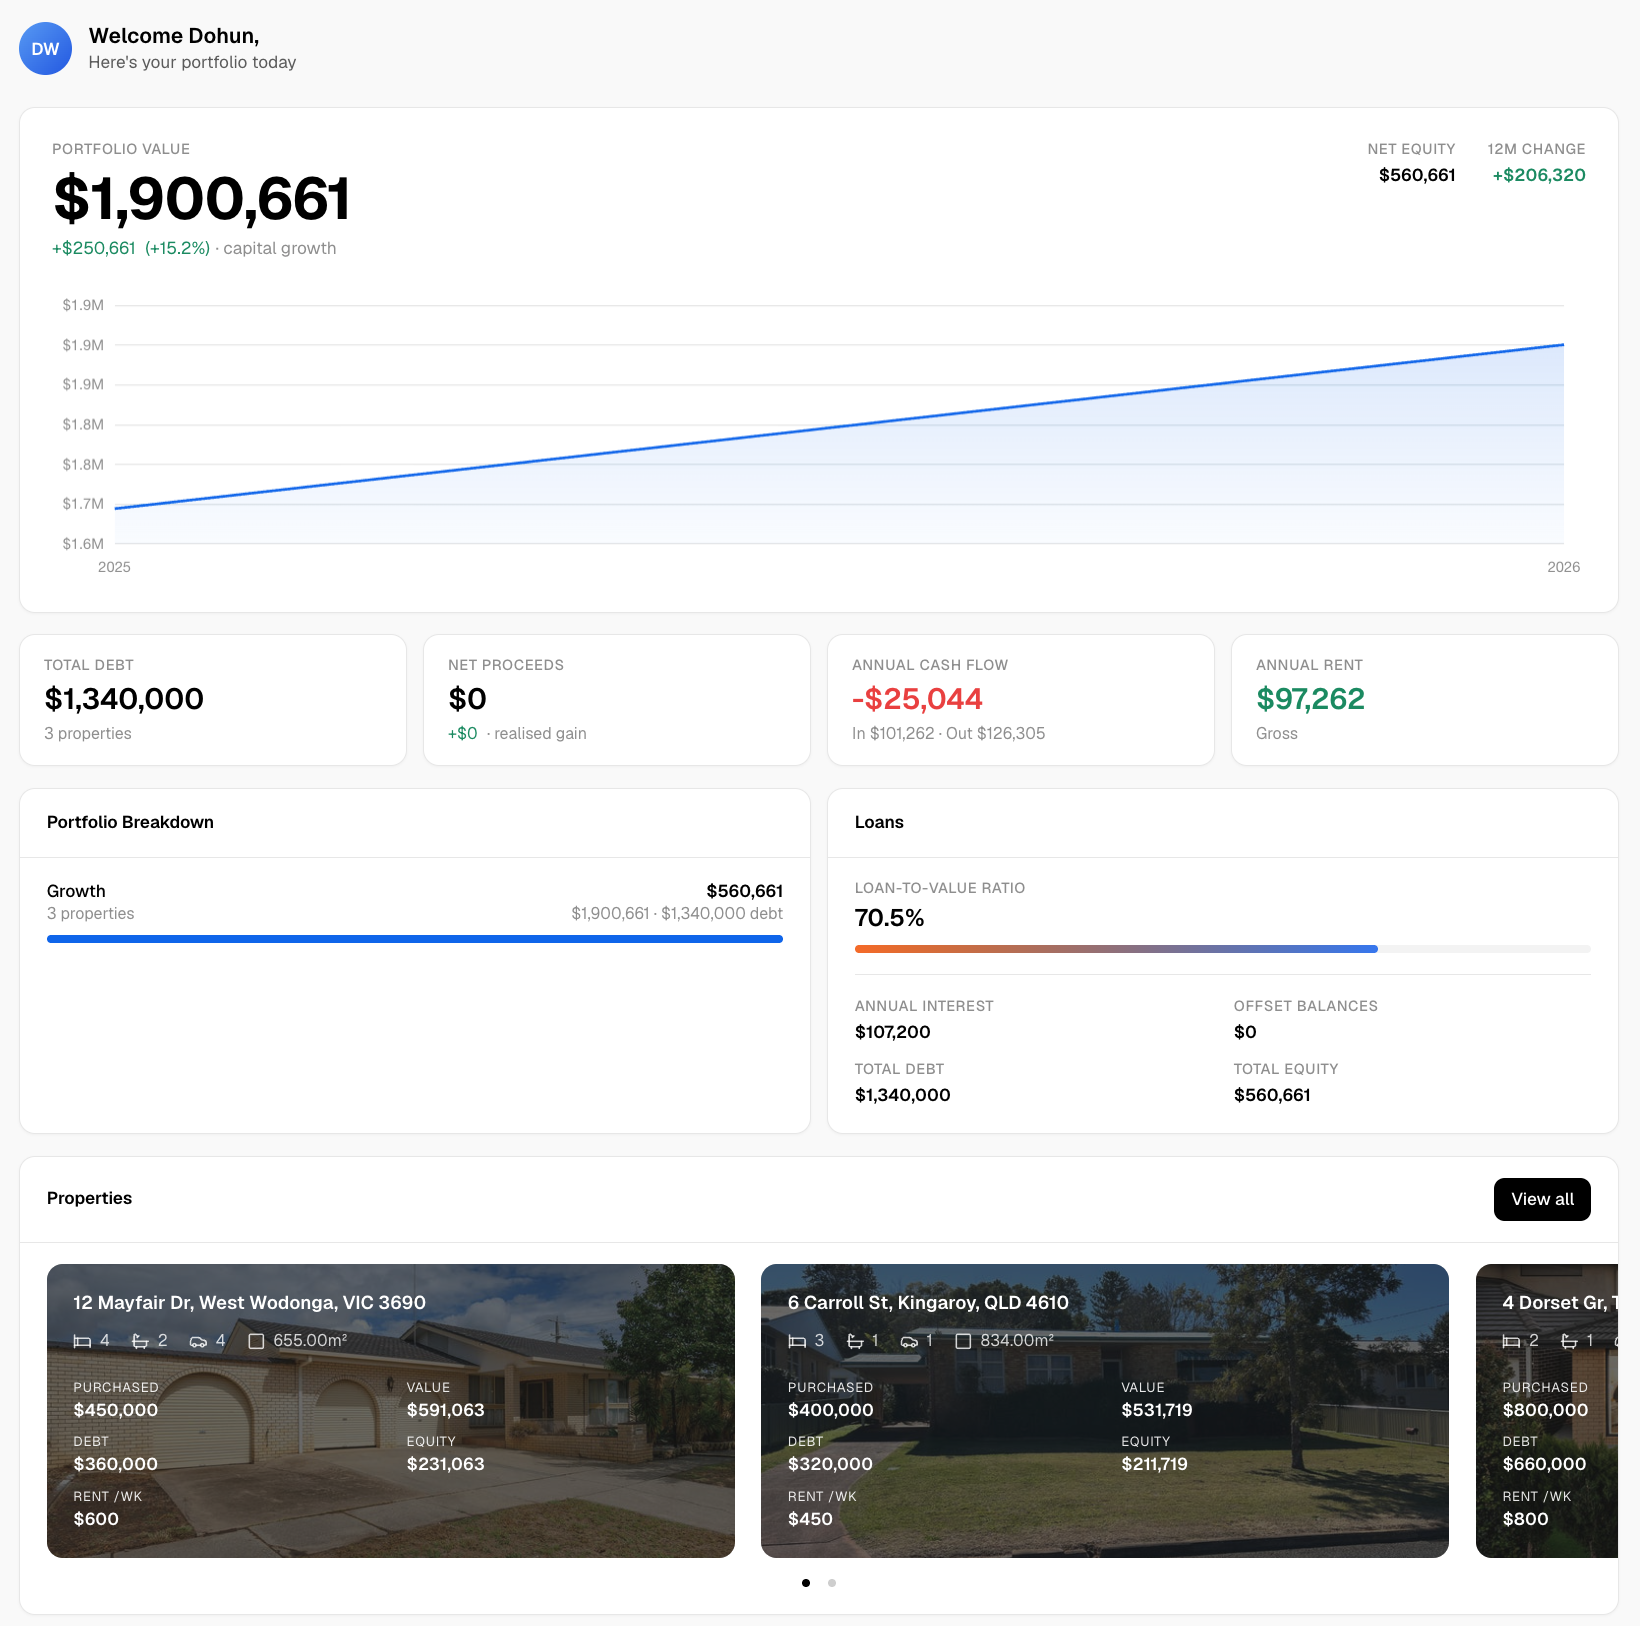
- Portfolio tracking dashboards that show gross yield, net yield, and cash flow across multiple properties in one view
- AI-powered investment chat for quick scenario questions without needing to rebuild a spreadsheet from scratch
- Suburb-level market research tools and hazard/risk overlays for Australian locations
The dashboard shows which property keeps positive cash flow under pressure and which one requires ongoing funding. That comparison, done manually, takes the better part of an afternoon. Done in the platform, it takes minutes.
Tools like this speed analysis and reduce arithmetic errors, but they do not replace a licensed financial adviser or mortgage broker for personalised tax and lending decisions.
Start benchmarking your property investments with Wealthstacker’s free toolkit at Wealthstacker.
Sources
The figures in this article draw on the following primary sources. Each is worth bookmarking if you plan to research specific suburbs or update your models as market conditions change.
- APRA — update to macroprudential settings / housing lending standards
- National vacancy rate rises to 1.3% — SQM Research (June 2026)
- Rental yield calculator Australia: formula + benchmarks (March 2026) — Mortgage World Australia
Data recency matters. Yield figures shift with both property prices and rental markets, sometimes quickly. Always cross-check a suburb’s yield against current rental listings, recent comparable sales, and the latest SQM vacancy data before making a decision. A yield figure that was accurate six months ago may look quite different today, particularly in Perth and Adelaide where rental markets have moved sharply.
To validate a local yield figure: pull three to five current rental listings for comparable properties, calculate the median weekly rent, annualise it, and divide by the asking price. Compare that against the SQM vacancy rate for the suburb and the council rates schedule for the local government area. That three-step check takes about 20 minutes and is far more reliable than any headline average.
This article provides general information only and is not financial, tax, or legal advice. For personalised guidance on property investment, borrowing capacity, and tax outcomes, consult a licensed financial adviser, mortgage broker, or registered tax agent.
This article is general information, not a substitute for advice from a qualified financial advisor. Consult a qualified financial professional about your own circumstances before acting on anything here.