
Property portfolio performance benchmarking guide for investors
TL;DR:
- Property portfolio benchmarking evaluates investment performance against standards, peers, and market indices. It uses key metrics like cap rate, IRR, and occupancy to inform strategic decisions and improve operational efficiency. Regular, structured reviews combining multiple methods enhance accuracy and portfolio management effectiveness.
Property portfolio performance benchmarking is the process of evaluating investment returns and operational efficiency using standardised metrics and peer comparisons to inform strategic investment choices. Most investors track rent and capital growth, but few measure performance against a defined benchmark. That gap is where portfolios quietly underperform. This guide covers the key metrics, benchmarking methods, institutional standards like the NCREIF Property Index and PREA Reporting Standards, and a practical review process you can apply to your own portfolio right now.
What key metrics and KPIs should you use for benchmarking your portfolio?
Effective benchmarking starts with choosing the right metrics before you compare anything. The wrong KPIs produce misleading conclusions, no matter how good your data is.
The core financial metrics every investor should track are:
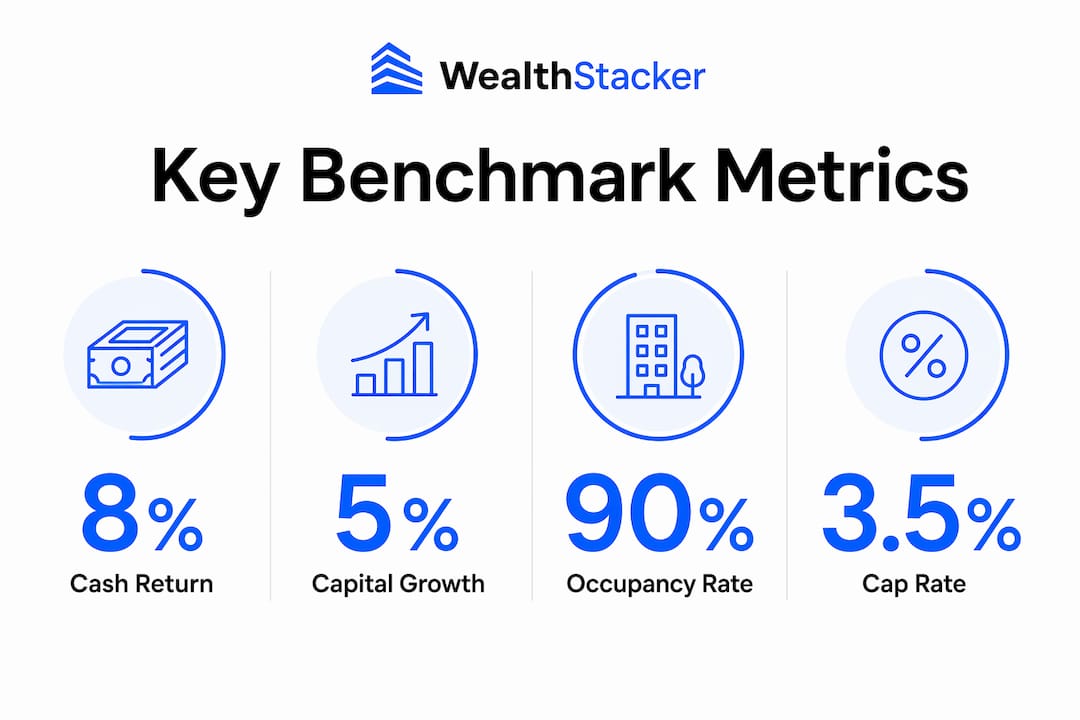
- Cap rate (capitalisation rate): net operating income divided by property value. This shows the unlevered yield of an asset and makes cross-property comparison straightforward.
- Cash-on-cash return: annual pre-tax cash flow divided by total cash invested. This reflects the actual return on your out-of-pocket capital, including debt effects.
- Internal rate of return (IRR): the annualised return across the full holding period, including purchase, income, and sale proceeds. IRR is the most complete measure of investment performance.
- Net operating income (NOI): gross rental income minus operating expenses, before debt service. NOI is the foundation for cap rate and most valuation models.
- Occupancy rate: the percentage of lettable space generating rent. Sustained occupancy below 95% signals either pricing, asset quality, or management issues.
- Debt service coverage ratio (DSCR): NOI divided by total debt payments. A DSCR below 1.2 is a warning sign for leveraged portfolios.
Beyond these basics, risk-adjusted metrics like the Sharpe ratio, tracking error, and alpha give you a clearer picture of whether your returns justify the risk taken. A portfolio generating 10% IRR with high volatility is not the same as one generating 9% with stable, predictable cash flows.
One metric investors frequently overlook is the separation of income return from capital appreciation. NCREIF Property Index data separates total return into income and appreciation components after capital expenditure. Chasing mark-to-market gains without accounting for capex distorts your true performance picture.

Pro Tip: Track your rental yield vs capital growth separately for each property. Blending them into a single return figure hides which assets are actually carrying the portfolio.
How do you benchmark using peer comparisons, relative returns, and absolute targets?
Benchmarking combines three distinct methods, and using only one gives you an incomplete picture. Each method answers a different question.
-
Peer comparison: Stack your portfolio against similar assets by type, location, and size. A Brisbane residential portfolio should not be compared to Sydney commercial assets. Peer benchmarking tells you whether your assets are competitive within their own category.
-
Relative return benchmarking: Compare your portfolio returns against a market index. The NCREIF Property Index is the standard for institutional commercial real estate. For Australian residential investors, state-level median price and rental yield data from CoreLogic or the Australian Bureau of Statistics serves a similar function. Relative benchmarking tells you whether you are keeping pace with the market.
-
Absolute return targets: Set explicit performance thresholds and measure against them. Common examples include IRR at or above 12%, occupancy at or above 95%, or cash-on-cash return above 7%. Absolute targets tell you whether the portfolio is meeting your personal investment objectives, regardless of what the market is doing.
The critical insight is that each method has a blind spot. Peer comparison can make a mediocre portfolio look good in a weak market. Relative returns can mask poor asset selection if the index is rising. Absolute targets ignore market context entirely. Combining all three removes those blind spots.
A practical example: a property generating 8% cash-on-cash return might beat the peer group average of 6%, match the index return, but still fall short of your 10% absolute target. That result tells you the asset is competitive but not meeting your wealth goals. The decision to hold, renovate, or sell becomes much clearer with that three-way comparison in hand.
Local market benchmarking is equally critical. National averages mask underperformance caused by local vacancy rates or supply pressures. An asset in a suburb with rising vacancy may look fine against a national benchmark but is clearly underperforming its local market.
What tools, standards, and data sources support portfolio benchmarking?
The quality of your benchmarking depends directly on the quality of your data sources and the standards you apply to reporting.
| Tool or standard | Type | Best use |
|---|---|---|
| NCREIF Property Index (NPI) | Institutional index | Unleveraged commercial real estate return comparison |
| PREA Reporting Standards | Reporting framework | Consistent asset-level disclosure and comparability |
| CoreLogic | Data provider | Australian residential price and yield benchmarks |
| Argus Enterprise | Analytics software | Commercial property cash flow modelling and valuation |
| Wealthstacker | Portfolio app | KPI tracking, automated valuations, and net worth modelling |
The NCREIF Property Index reports unleveraged quarterly total returns and separates income from appreciation after capital expenditure. That separation is what makes it genuinely useful for benchmarking rather than just tracking. The NPI is the most widely used institutional benchmark for commercial real estate in the United States, and Australian institutional investors frequently reference it for cross-market context.
One critical detail: the NPI reports unleveraged returns. If your portfolio carries debt, comparing directly to the NPI without adjustment will overstate your relative performance during rising markets and understate it during downturns. Matching benchmark leverage to your portfolio’s actual leverage is not optional. It is the difference between a meaningful comparison and a misleading one.
The 2025 NCREIF PREA Reporting Standards expand asset and investment-level reporting requirements, improving transparency and machine readability for benchmarking. These standards apply to fiscal years after 31 december 2025, but early adoption gives investors a head start on comparability.
Pro Tip: Use local vacancy and rental data alongside national indices. National averages regularly mask underperformance at the suburb or precinct level.
How do you build an effective benchmarking process and review cadence?
A benchmarking process that runs once a year is not a process. It is a snapshot. Effective real estate portfolio analysis requires a repeatable system with defined review points.
-
Set clear investment objectives first. Define what success looks like before choosing KPIs. A growth-focused investor prioritises IRR and capital appreciation. An income-focused investor prioritises cash-on-cash return and occupancy. Your KPIs must match your strategy.
-
Gather and organise your data. Collect transactional records, rental income, operating expenses, vacancy history, and debt schedules for every property. Inconsistent data produces unreliable benchmarks.
-
Build a dashboard for KPI tracking. Role-based dashboards that aggregate transactional data help investors monitor financial performance, operational efficiency, tenant health, and portfolio growth in one view. Spreadsheets work at small scale, but purpose-built tools handle complexity better.
-
Establish a review cadence. Monthly check-ins cover occupancy, rent collection, and expense variances. Quarterly deep dives assess cap rate movements, NOI trends, and comparison against benchmarks. Annual sessions review strategy, asset allocation, and whether the portfolio still matches your objectives.
-
Investigate performance gaps at the property level. When a property underperforms, identify the driver. Is it vacancy, below-market rents, excessive maintenance costs, or a structural issue with the asset? Root cause analysis at the property level is what turns benchmarking from a reporting exercise into a decision-making tool.
Common mistakes to avoid:
- Comparing leveraged portfolio returns to unleveraged indices without adjustment
- Using only national benchmarks and ignoring local vacancy and rent data
- Tracking too many metrics and losing focus on the three or four that drive decisions
- Reviewing performance annually instead of quarterly, which delays corrective action
- Ignoring portfolio diversification across property types when assessing concentration risk
What are the common challenges in property portfolio benchmarking?
Benchmarking sounds straightforward until you try to do it consistently across a multi-property portfolio. Several practical challenges undermine accuracy.
- Data quality and availability: Inconsistent record-keeping across properties makes aggregation unreliable. Missing expense records or incomplete vacancy histories skew every metric that depends on them.
- Benchmark misalignment: Comparing a leveraged residential portfolio to an unleveraged commercial index produces a false reading. The benchmark must match the portfolio’s leverage, asset type, and geography.
- Market volatility and timing effects: Short-term market movements can make a well-managed portfolio look poor and a poorly managed one look strong. Benchmarking over a single quarter is rarely meaningful.
- Over-reliance on a single metric: Investors who track only yield or only capital growth miss the full picture. A high-yield property with deteriorating tenant quality is a risk, not a success.
- National averages masking local issues: JLL research shows that yield and capital growth correlate negatively in some sectors. A property in a softening local market may look fine against a national average while quietly losing ground.
The solution to most benchmarking challenges is standardisation. Using frameworks like NCREIF PREA Reporting Standards, combining multiple metric types, and validating data with local comparables removes the most common sources of error.
Without asset-level disclosures and standard reporting formats, portfolio benchmarking loses the granularity needed to identify what is actually driving variance. That makes investment decisions riskier, not safer.
Wealthstacker makes portfolio benchmarking practical
Tracking KPIs, running quarterly reviews, and comparing assets against local benchmarks takes time and reliable data. Wealthstacker brings those functions together in one place.
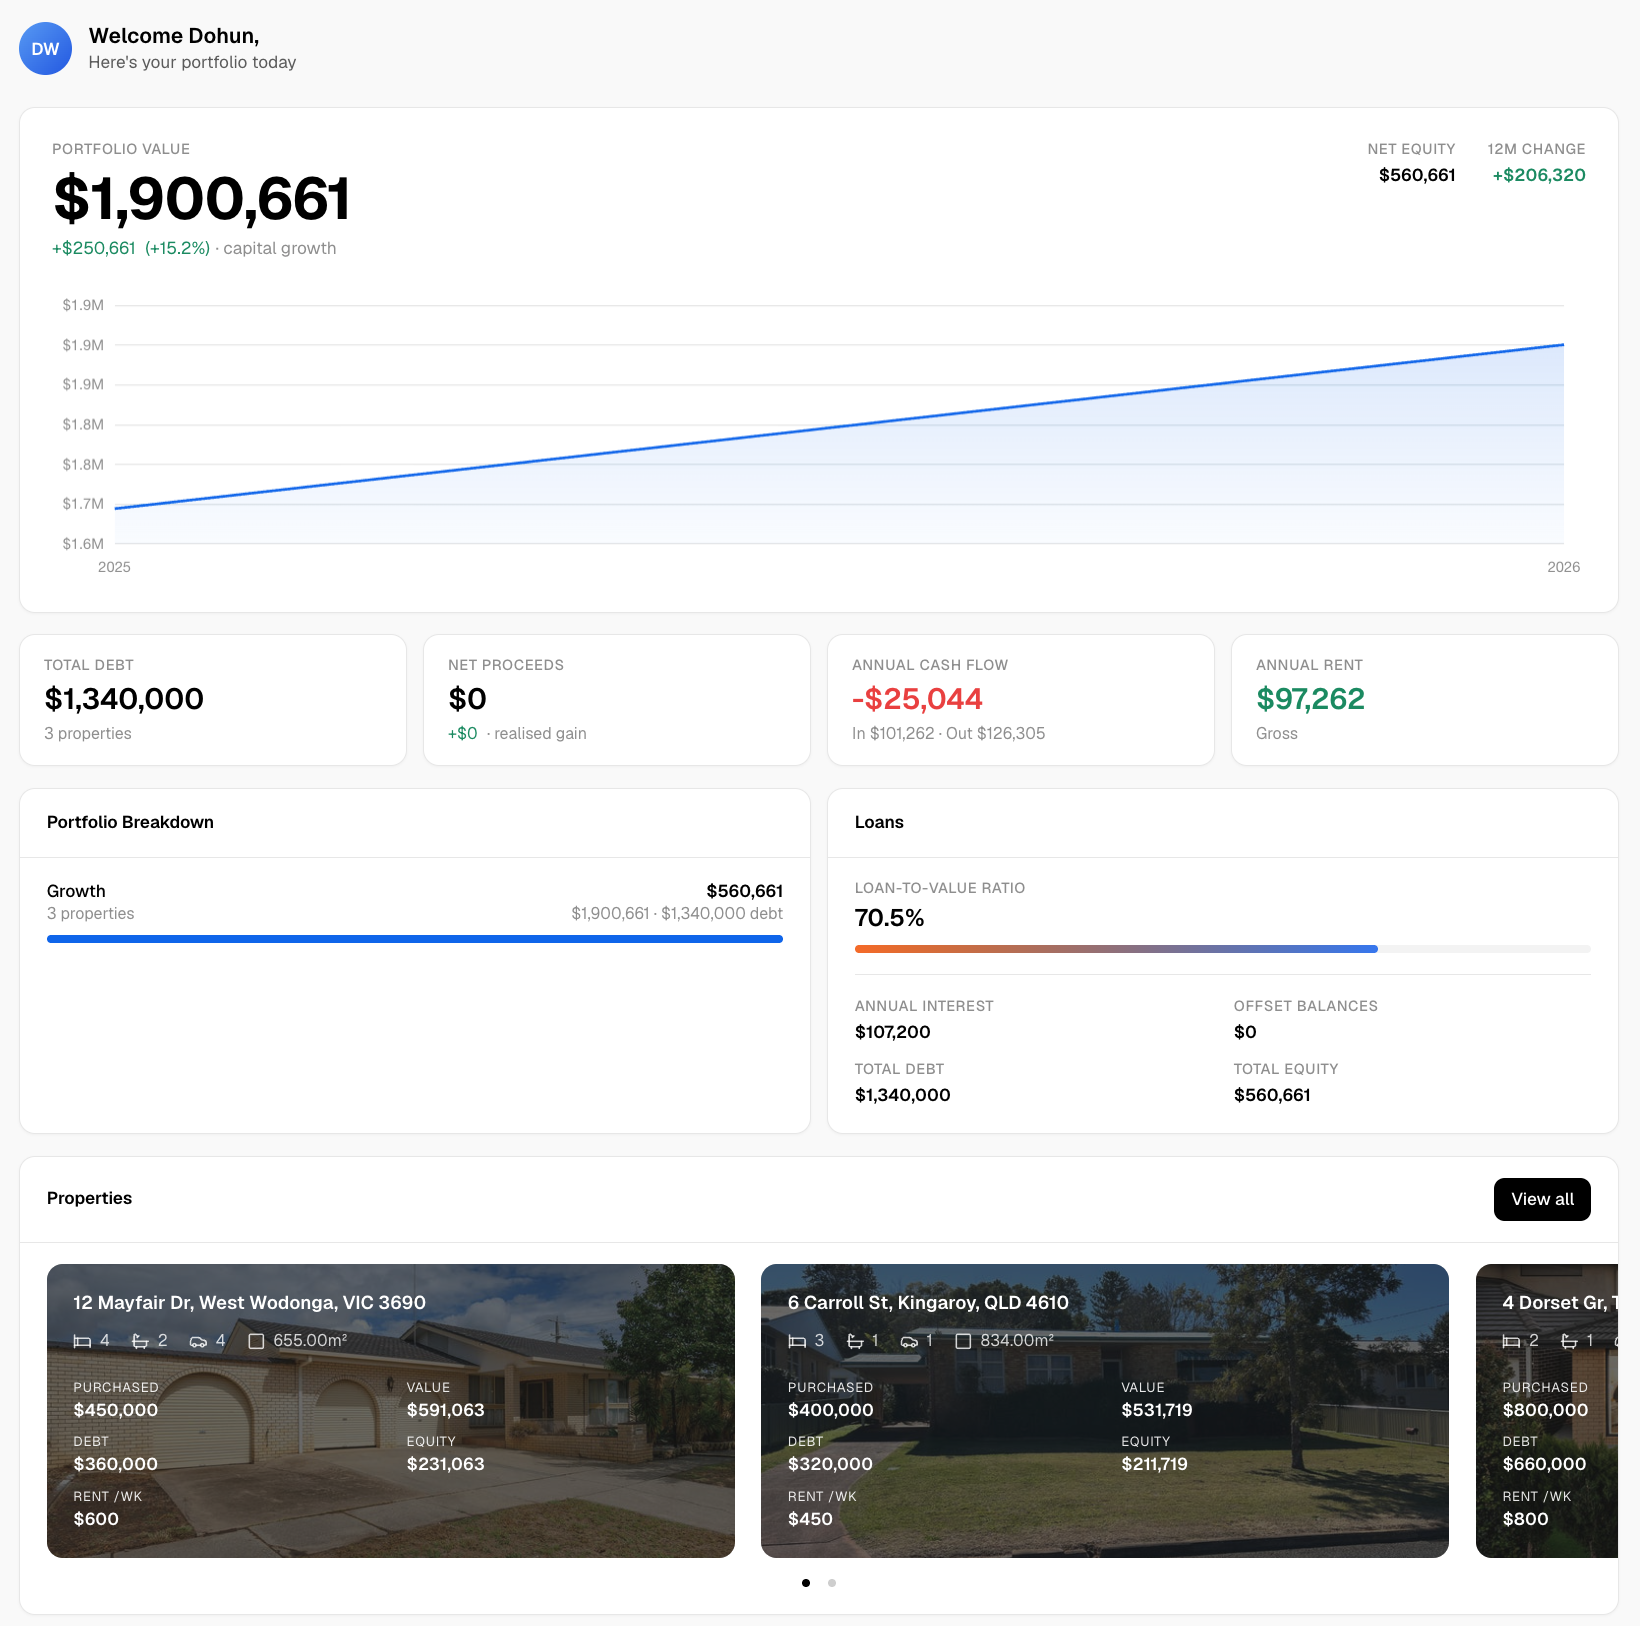
The Wealthstacker portfolio tracker delivers automated quarterly property valuations at no cost, so your benchmarking always starts with current market data. The platform models both rentvesting and buying strategies, letting you compare net worth outcomes across different portfolio paths in real time. AI-driven modelling generates personalised forecasts for wealth accumulation, which means your performance review is tied directly to your long-term financial goals, not just last quarter’s numbers. For investors who want to move from spreadsheets to a purpose-built benchmarking system, Wealthstacker is a direct upgrade.
FAQ
What is property portfolio performance benchmarking?
Property portfolio performance benchmarking is the process of measuring investment returns and operational efficiency against defined standards, peer groups, or market indices. The goal is to identify whether each asset and the portfolio as a whole is meeting its investment objectives.
Which metrics matter most for benchmarking a property portfolio?
Cap rate, IRR, cash-on-cash return, NOI, and occupancy rate are the core metrics for real estate portfolio analysis. Risk-adjusted metrics like the Sharpe ratio add depth when comparing portfolios with different risk profiles.
How often should I review my portfolio against benchmarks?
Monthly check-ins cover operational metrics like occupancy and rent collection. Quarterly deep dives assess financial performance against benchmarks, and annual sessions review overall strategy and asset allocation.
What is the NCREIF Property Index and why does it matter?
The NCREIF Property Index reports unleveraged quarterly total returns for institutional commercial real estate, separating income from appreciation after capital expenditure. It is the most widely used benchmark for comparing commercial property performance objectively.
Why do national benchmarks sometimes give misleading results?
National averages aggregate performance across diverse markets and can mask underperformance driven by local vacancy rates or supply issues. Benchmarking against local comparables gives a more accurate picture of how individual assets are actually performing.
Key takeaways
Effective property portfolio benchmarking combines peer comparisons, relative return indices, and absolute targets, then applies them consistently through a structured quarterly review process.
| Point | Details |
|---|---|
| Use three benchmarking methods | Combine peer comparison, relative return indices, and absolute targets for a complete performance picture. |
| Match benchmark leverage to your portfolio | Comparing leveraged returns to unleveraged indices like the NPI produces misleading results without adjustment. |
| Separate income from appreciation | Track income return and capital growth post-capex separately to avoid chasing temporary valuation gains. |
| Benchmark locally, not just nationally | National averages mask suburb-level underperformance caused by local vacancy or supply pressures. |
| Review on a defined cadence | Monthly, quarterly, and annual reviews turn benchmarking from a one-off exercise into a decision-making system. |