
Portfolio performance metrics checklist: Australian investor guide
TL;DR:
- Monitoring eight key metrics quarterly allows landlords to efficiently manage their entire property portfolio in under an hour. Using formulas and alerts for yields, cash flow, and leverage helps identify underperformance and maintain financial health, supported by automated tools like Wealthstacker. Regular updates and role-based benchmarks ensure tailored insights, aiding strategic decisions and proactive risk management.
Track these eight metrics every quarter and you can audit, compare, and act on your entire property book in under an hour. The minimum set: gross rental yield, net rental yield, net cash flow, interest cover ratio, loan-to-value ratio (LVR), equity growth, capital growth, and total return. The one-line recommendation: adopt quarterly portfolio reviews, attach a current valuation to each property, and set alerts for three triggers — interest cover falling below 1.5x, any property slipping into negative cash flow, and LVR drifting above your lender’s threshold.
Your TL;DR checklist — copy this to a spreadsheet now:
- Gross rental yield = (Annual rent ÷ Property value) × 100
- Net rental yield = ((Annual rent − Annual expenses) ÷ Property value) × 100
- Net cash flow = Monthly rent − (Mortgage repayment + all operating expenses)
- Interest cover ratio = Net operating income ÷ Annual interest expense
- LVR = (Loan balance ÷ Property value) × 100
- Equity = Current market value − Outstanding loan balance
- Capital growth = ((Current value − Purchase price) ÷ Purchase price) × 100
- Total return = Net rental income + Capital gain (pre-tax)
Table of Contents
- Essential metrics and exact formulas for each property
- What data to collect, where to get it, and how often
- How to benchmark your numbers for Australian residential property
- A quarterly reporting template you can copy today
- How to turn metrics into decisions
- Common mistakes and Australia-specific caveats
- Key takeaways
- Wealthstacker makes quarterly tracking automatic
- Useful Australian sources and further reading
Essential metrics and exact formulas for each property
Every metric below has a formula you can calculate from data you already hold. The table covers the core set; the worked example below it shows how they connect.
| Metric | Formula | Why it matters |
|---|---|---|
| Gross rental yield | (Annual rent ÷ Value) × 100 | Quick comparison across suburbs |
| Net rental yield | ((Annual rent − Expenses) ÷ Value) × 100 | True income after costs |
| Net operating income (NOI) | Annual rent − Operating expenses (excl. interest) | Basis for interest cover and valuation |
| Cash-on-cash return | Annual pre-tax cash flow ÷ Cash invested × 100 | Measures return on your actual cash outlay |
| Interest cover ratio (ICR) | NOI ÷ Annual interest expense | Debt serviceability buffer |
| LVR | (Loan balance ÷ Value) × 100 | Lender risk threshold and equity trigger |
| Equity | Current value − Loan balance | Usable capital for next purchase |
| Total return | Net income + Capital gain | Full picture of wealth created |
| IRR / MWR | Discounted cash flow over hold period | Compares properties on equal footing |
Worked example — single property, 12 months: Purchase price $650,000. Current value $690,000. Weekly rent $520 ($27,040/year). Annual expenses (management, insurance, rates, strata, repairs) $7,200. Loan balance $520,000 at 6.2% interest = $32,240/year.
- Gross yield is calculated as annual rent divided by property value, expressed as a percentage.
- Net yield is calculated as annual rent minus expenses divided by property value, expressed as a percentage.
- Net operating income (NOI) is annual rent minus operating expenses (excluding interest).
- Interest cover ratio (ICR) is net operating income divided by annual interest expense, indicating debt serviceability.
- Net cash flow is monthly rent minus mortgage repayment and all operating expenses, showing positive or negative cash flow.
- Capital growth is calculated as the percentage increase in property value compared to purchase price.
- Total return represents net rental income plus capital gain, showing overall wealth created by the investment.
The ATO treats rental income as assessable and most expenses as deductible; interest, depreciation, and management fees reduce taxable income. Capital gains are assessed on disposal, with a 50% CGT discount for assets held over 12 months.
Pro Tip: Gross yield is the metric most likely to mislead you. Two properties with identical gross yields can have wildly different cash flows once strata levies, land tax, and vacancy are included. Always run net yield and cash-on-cash before comparing properties.

What data to collect, where to get it, and how often
Accurate metrics depend on clean inputs. Per property, capture: purchase price, stamp duty, and acquisition costs; current market value with valuation date; gross rent by month; vacancy days; loan balance and interest rate; interest paid; property management fees; strata levies; insurance; repairs and capital expenditure; council rates; land tax (where applicable); and your depreciation schedule from a quantity surveyor.
At portfolio level, add: aggregated rents and total debt, cash buffer balance, geographic spread by state and suburb, and entity flags (individual, trust, SMSF).
Recommended cadence:
- Monthly: reconcile bank feeds, rent roll, and loan statements. Flag arrears and vacancy days.
- Quarterly: update market valuations, recalculate all KPIs, run the dashboard, and review alerts.
- Ad hoc: update immediately after a rate change, major repair, or settlement.
For Australian data sources, ABS provides population and wage context useful for rental demand forecasting. The ATO publishes guidance on deductible expenses, depreciation rules, and CGT treatment. The RBA cash rate decisions directly affect your interest costs and should be checked each quarter. CoreLogic publishes suburb-level median price and rental data, useful for validating your own valuations and benchmarking yields. None of these replace a formal valuation, but together they give you a defensible basis for quarterly estimates.
How to benchmark your numbers for Australian residential property
A metric only means something when you compare it to the right target — and the right target depends on what job the property is doing in your portfolio. Role-based benchmarking divides holdings into three categories: capital growth assets, cashflow assets, and lower-risk ballast. Each uses different primary KPIs.
A capital growth property in an inner-ring Sydney or Melbourne suburb might deliver a gross yield of 2.5–3.5% but compound at 6–8% annually. A cashflow property in a regional centre or outer suburb might yield 5–6% gross but grow more slowly. A ballast property — often a well-located, low-maintenance asset — prioritises stability over either metric.
As an illustrative example of how yields vary by market, HtAG’s research shows suburbs like Armadale WA recording gross yields around 4% while other markets sit materially lower — a reminder that price alone tells you nothing about income performance.
Use ABS CPI data to adjust real returns: a 4% nominal yield in a 3.5% inflation environment is a thin real return. RBA cash rate trends set the floor for your ICR stress tests. CoreLogic median growth figures let you check whether your property is keeping pace with its suburb.
Pro Tip: Older properties with high depreciation schedules often show stronger after-tax returns than their net yield suggests. Factor in your quantity surveyor’s schedule before deciding a low-yield asset is underperforming.
A quarterly reporting template you can copy today
A practical quarterly template combines a bank feed reconciliation, a valuation snapshot, quarter-on-quarter KPI deltas, and a stress-test panel — so you see both trend and resilience in one view. Here is the spreadsheet structure:
| Column | Example value / formula | Flag rule |
|---|---|---|
| Property address | 12 Smith St, Suburb | — |
| Current valuation ($) | Manual or automated input | — |
| Loan balance ($) | From bank statement | — |
| LVR (%) | =Loan÷Value×100 | Red if >80% |
| Gross rent (annual $) | =Weekly rent×52 (weeks per year) | — |
| Operating expenses ($) | Sum of all costs | — |
| NOI ($) | =Rent−Expenses | — |
| Interest paid ($) | From loan statement | — |
| ICR | =NOI÷Interest | Red if <1.5 |
| Net cash flow ($) | =NOI−Interest | Red if negative |
| Net yield (%) | =(Rent−Expenses)÷Value×100 | — |
| Capital growth (%) | =(Value−Purchase)÷Purchase×100 | — |
| Vacancy days | Manual input | Amber if >21 days |
Add a portfolio summary row at the bottom that aggregates total value, total debt, portfolio LVR, and total net cash flow. For the dashboard, surface the top five KPIs as large numbers with colour coding, add a small trend line for net cash flow and ICR over the last four quarters, and include an alerts panel for any red flags.
For reporting best practices including accountant-ready export formats, connect your bank feeds directly to your tracking tool so the template stays current without manual entry.
Checklist — fields to capture each quarter per property:
- Current market valuation and valuation date
- Loan balance, interest rate, and interest paid
- Gross rent received and vacancy days
- All operating expenses itemised
- Depreciation schedule reference
- ICR, LVR, net yield, net cash flow calculated
- Capital growth year-to-date and since purchase
How to turn metrics into decisions
Numbers without rules are just noise. These if-then triggers give you a clear decision path:
- ICR below 1.5: Review loan terms immediately. Model a refinance at current rates. If ICR stays below 1.0 after refinancing, the property is a sell candidate unless capital growth justifies the carry cost.
- Negative cash flow for two consecutive quarters: Assess whether rent is below market. If the gap is structural (high strata, low-demand area), model a sale and redeploy equity.
- LVR above 80%: Stop drawing equity from this property until values recover. If LVR is lender-triggered, contact your broker before the bank does.
- Net yield below target for the property’s role: For a cashflow asset, this is a direct underperformance signal. For a growth asset, tolerate it if capital growth is on track.
- Vacancy exceeds 21 days: Review rent pricing against local comparables. Two consecutive high-vacancy quarters warrant a property manager review.
Quick stress tests to run quarterly: A 2% rent fall on a $27,040 income reduces annual cash flow by $540 — manageable. A 150 basis point rate rise on a $520,000 loan adds $7,800/year in interest — that can flip a marginally positive property to negative cash flow. An eight-week vacancy costs roughly $4,160 in lost rent on the same property. Run all three simultaneously to find your worst-case buffer requirement.
For portfolio rebalancing triggers and when to shift a property from growth to sale candidate, the decision usually comes down to whether the asset still fits its assigned role.
Common mistakes and Australia-specific caveats
Pitfalls that catch Australian investors out:
- Relying on gross yield as the primary comparison metric — net measures reveal true performance after expenses and finance costs
- Ignoring vacancy clustering: multiple properties in the same suburb or market segment can go vacant simultaneously
- Underestimating land tax exposure, especially when properties are held across multiple states with different thresholds
- Using a stale valuation — a 12-month-old figure distorts LVR, equity, and yield calculations
- Overlooking SMSF borrowing rules, which restrict certain refinancing and equity release strategies under limited recourse borrowing arrangements
Tax and timing caveats: Negative gearing reduces your taxable income in the year losses occur, but it does not make a loss-making property profitable — it reduces the cost of holding it. Depreciation schedules improve after-tax NOI in the short term but reduce your cost base for CGT purposes on disposal. Time a sale past the 12-month mark to access the 50% CGT discount. Major renovation costs in a single year distort NOI; exclude them from trend analysis and treat them as capital expenditure.
Pro Tip: When a renovation or one-off sale skews a year’s figures, flag that year in your trend chart and calculate a normalised NOI excluding the outlier. A three-year rolling average smooths out the noise and gives you a cleaner read on underlying performance.
Key takeaways
Quarterly reporting with current valuations and three alert thresholds — ICR, cash flow, and LVR — is the minimum viable performance measurement framework for an Australian residential property portfolio.
| Point | Details |
|---|---|
| Track eight core metrics | Gross yield, net yield, NOI, ICR, LVR, equity, capital growth, and total return cover the full picture. |
| Use role-based benchmarks | Target ranges differ for growth, cashflow, and ballast properties — never apply one yield target to all. |
| Review quarterly, alert monthly | Reconcile bank feeds monthly; recalculate all KPIs and run stress tests each quarter. |
| Set three hard alert thresholds | Flag ICR below 1.5, negative cash flow, and LVR above 80% for immediate review. |
| Wealthstacker automates the process | Wealthstacker delivers free automated quarterly valuations, a portfolio dashboard, and scenario modelling to replace manual spreadsheet tracking. |
Wealthstacker makes quarterly tracking automatic
Tracking eight metrics across multiple properties every quarter is straightforward in theory and tedious in practice. Wealthstacker removes the friction: free automated quarterly valuations keep your LVR and equity figures current without manual revaluations, and the portfolio dashboard surfaces ICR, net cash flow, and capital growth in one view.
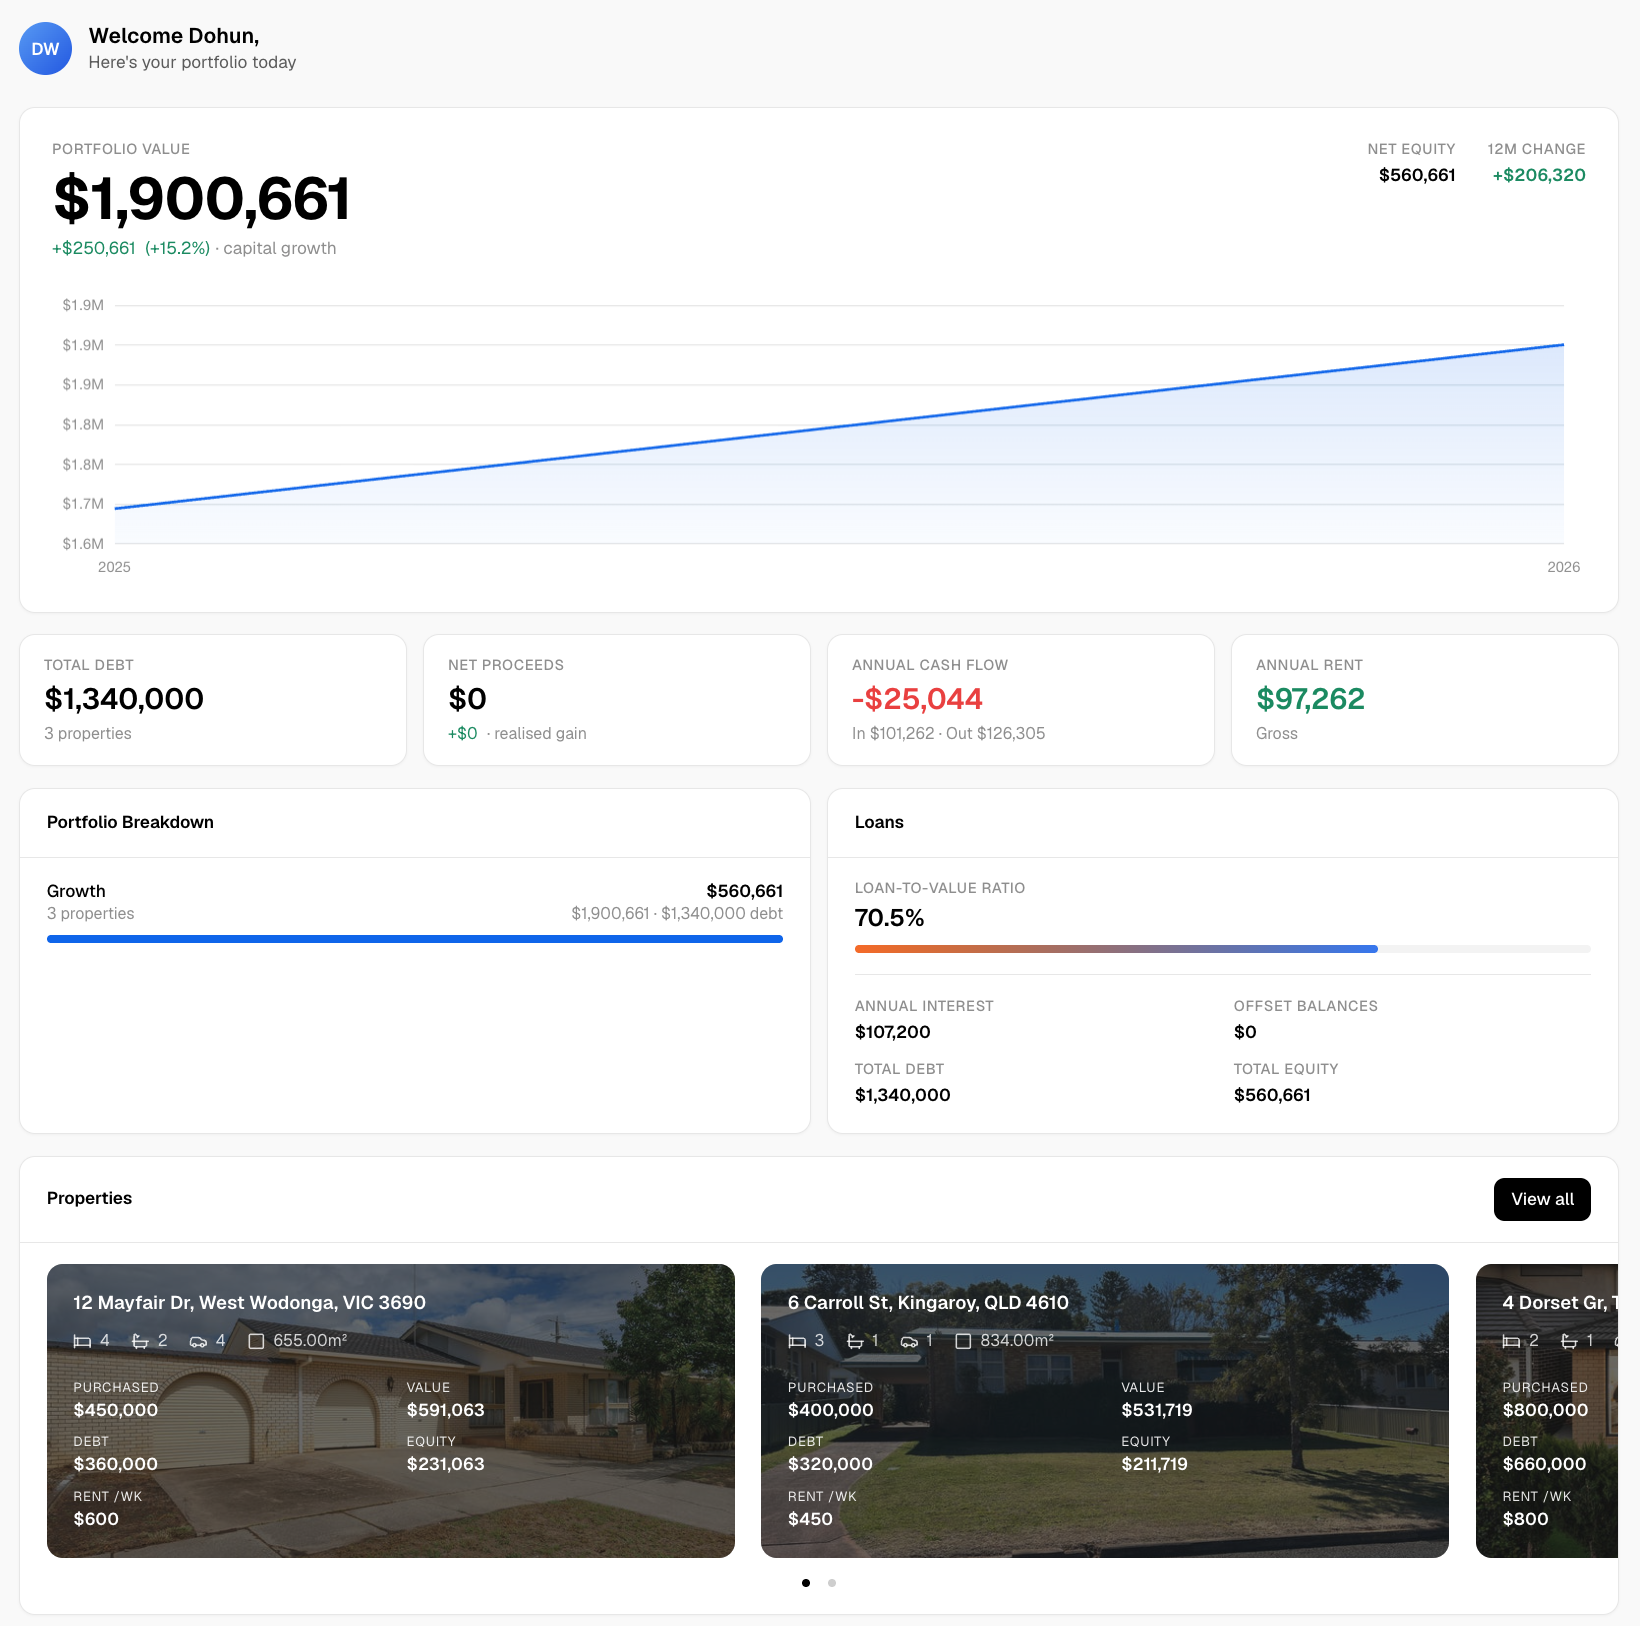
The 15-year investment modelling tools let you stress-test a rate rise or rent fall before it hits your cash account, and the AI-powered chat assistant answers scenario questions without a spreadsheet. For investors comparing rentvesting and buying strategies, Wealthstacker’s goal planner maps projected net worth across both paths. Exportable reports are formatted for accountants, so your quarterly review doubles as tax preparation.
Sign up at Wealthstacker to connect your property records, run your first quarterly report, and see which of your properties is actually earning its place in the portfolio.
Useful Australian sources and further reading
Primary data sources for Australian property investors:
- ABS (Australian Bureau of Statistics): demographic and wage data for rental demand context; updated quarterly and annually
- ATO (Australian Taxation Office): definitive guidance on rental deductions, depreciation rules, negative gearing, and CGT treatment
- RBA (Reserve Bank of Australia): cash rate decisions and economic statements; check after each board meeting for interest cost context
- CoreLogic: suburb-level median prices, rental yields, and days on market; use to validate quarterly valuations and benchmark yields
- PropTrack (REA Group): investor-focused suburb rankings combining capital growth, rental yield, and renter demand signals
- Wealthstacker blog — portfolio monitoring tips: quarterly checklist workflows and dashboard templates for busy investors
- RentrIQ portfolio insights: automated landlord analytics and portfolio-level metrics for investors wanting deeper performance data
This article is general information only and does not constitute financial, tax, or legal advice. Confirm current rules and rates with the ATO or a qualified adviser for your specific situation.
Recommended
- Property portfolio performance benchmarking guide for investors | WealthStacker
- Busy investor portfolio monitoring tips: 2026 guide | WealthStacker
- Property investment checklist for beginners: 2026 guide | WealthStacker
- Passive property investment strategies for Australian professionals | WealthStacker