
Days on Market: 30, 60 and 90 Day Rules To Price, Offer and Forecast
Days on market is the number of days a property sits actively listed for sale, counted from when it first goes live on a portal to the date it goes under offer or sells. A short DOM, generally under 30 days, signals strong buyer demand chasing limited stock. A long DOM, often past 60 to 90 days, usually points to a price mismatch rather than something wrong with the property itself.
TL;DR:
- A property relisted after withdrawal can reset its DOM, leading to discrepancies between portals and misleading market signals.
- Suburb median DOM less than 30 days indicates strong demand, while over 90 days suggests a price mismatch or weak buyer interest.
- The significance of DOM varies with market conditions, seasonal factors, and sample size, so it should always be viewed alongside other data like vendor discounts.
- Buyers should leverage longer DOM periods for negotiation and sellers should consider price adjustments at the 30 to 60-day mark to avoid prolonged stalls.
- Rising or falling DOM trends over multiple quarters better predict future price movements than one-off figures, especially when combined with inventory data.
Table of Contents
- Days on market meaning: how it’s calculated and the common variants
- Where to find days on market and what the portal fields mean
- Why days on market matters for buyers, sellers and investors
- Benchmarks and thresholds: quick numeric rules of thumb
- How to use days on market when making offers or pricing a property
- Limitations and common mistakes when interpreting days on market
- How Wealthstacker factors days on market into valuations
- Sources
Days on market meaning: how it’s calculated and the common variants
Every DOM figure starts and stops at specific, defined moments, and those moments matter more than most buyers or sellers realise. The clock starts the day a listing goes live as “for sale” on a portal or through an agent’s system, and it stops the day the status changes to “sold” or “under offer.” That’s the version most agencies use, and REIWA’s own explanation of the calculation confirms this is the industry standard baseline, though execution varies between portals.
Where it gets messy is everything that happens in between. A property withdrawn and relisted three weeks later might show a fresh DOM count of zero, even though it’s been effectively for sale for months. Change agents mid-campaign and some systems reset the clock; others carry the original listing date through. This is why two portals can show wildly different DOM figures for the same address.
You’ll also run into several labelled variants that all describe slightly different things:
- DOMM (days on market, month) tracks the current listing cycle only, ignoring any prior withdrawn attempts.
- DOMP (days on market, property) attempts to capture the cumulative history across all listing attempts for that specific property.
- Active days counts only the days the listing was live and visible, excluding any offline or under-negotiation periods.
- Cumulative days on market adds every listing period together, treating relists as one continuous campaign rather than a fresh start.
Suburb-level or “average days on market” figures are built by aggregating these individual listing numbers, usually as a median rather than a mean, because a handful of extreme outliers (a property that sat unsold for 400 days) would otherwise distort the picture badly. That’s part of why a suburb report showing “38 days median DOM” can still hide individual listings that sold in a week and others that took four months.
Where to find days on market and what the portal fields mean
Most major listing portals display DOM directly in the listing header, often as “time on market” or “on market for X days,” sitting right below the price. Suburb and market reports go further, showing median DOM, a distribution chart, and sometimes a trend line comparing this quarter to the last. Data vendors like DSR present DOM as the median number of days a property spends advertised before selling, alongside historical comparisons that show whether a suburb is speeding up or slowing down.
Here’s what to check when the number looks off or missing:
- If DOM shows as zero on a listing that clearly isn’t new, check the listing history. It’s likely been relisted after a withdrawal.
- If a portal shows no DOM figure at all, the listing may be a private treaty sale still in early days, or the portal hasn’t updated its data feed.
- Cross-check the “listed date” against today’s date manually if the displayed DOM figure seems inconsistent with the campaign you remember seeing.
- Compare portal figures against agency-reported figures. They frequently differ by a week or more.
Pro Tip: Before trusting a suburb’s headline DOM figure, click into the underlying report and check the sample size. A “32-day median” built from four sales tells you almost nothing about actual market conditions.
Why days on market matters for buyers, sellers and investors
DOM isn’t just a trivia stat sitting under the price. It’s one of the fastest-moving signals of how balanced (or unbalanced) supply and demand is in a specific pocket of the market, and each type of reader should be pulling something different from it.
-
Buyers should treat DOM as a negotiation clock. A property sitting at 45 days when the suburb median is 30 has likely had its open homes come and go without an offer. That’s leverage. Walking in with a slightly below-asking offer on day 50 carries far less risk of rejection than the same offer on day 5.
-
Sellers should read DOM as a real-time report card on price and presentation. If your campaign passes the local median without a serious offer, the market is telling you something the agent’s enthusiasm isn’t. Which Real Estate Agent’s glossary makes the point plainly: DOM measures how long a listing stays advertised before sale, and a stretched timeline usually means the price or the marketing needs adjusting, not that buyers have found some hidden flaw.
-
Investors should watch DOM trajectory, not the snapshot. A suburb moving from a 55-day median to 35 days over two quarters is showing rising competition among buyers before that pressure fully shows up in headline price growth. This is the leading-indicator angle that makes DOM genuinely useful for timing entry into a market rather than reacting after prices have already moved.
None of these readings work well in isolation, though. A falling DOM alongside rising inventory can mean agents are simply pricing more aggressively to force quick sales, not that demand is genuinely surging. Market analysts increasingly stress that DOM needs to sit alongside vendor discounting and stock-on-market figures before you draw a firm conclusion. One without the others is a partial picture at best.
Benchmarks and thresholds: quick numeric rules of thumb
Balanced markets typically post a median DOM generally in the several weeks range, and that band is worth memorising because it’s the reference point everything else gets measured against. Much shorter DOM indicates genuinely hot conditions where multiple buyers compete for limited stock, while much longer DOM signifies a cooling market where vendors often accept price cuts to close deals.
The predictive power behind these bands is where it gets interesting for investors specifically. HtAG’s analysis of suburb-level data found suburbs with DOM under 30 days delivered average 12-month forward price growth of roughly 11.8%, while suburbs sitting above 90 days averaged forward growth of around negative 2.3% over the same period. That’s a meaningful gap, and it’s part of why DOM gets used as a leading indicator rather than just a historical curiosity.
A rough reading guide:
- Under 30 days: Strong demand, limited stock, expect competitive bidding and minimal negotiating room.
- 30 to 60 days: Balanced conditions. Standard negotiation applies; neither side holds overwhelming leverage.
- 60 to 90 days: Demand softening or pricing too ambitious. Buyers gain leverage; sellers should reassess.
- 90+ days: Clear mismatch between asking price and market appetite, or a niche property type facing a thin buyer pool.
Two caveats matter here. First, these bands shift with the season. Regional and coastal markets often see genuine DOM spikes over winter that have nothing to do with weakening demand. Second, always check whether you are looking at a median or a mean, and how many sales sit behind the figure. A regional suburb with six sales a quarter can swing from a 20-day median to a 90-day median on the back of one or two unusual outcomes, so treat small-sample DOM figures with real caution.
How to use days on market when making offers or pricing a property
DOM only earns its keep when it changes what you actually do. Here’s how to translate the number into action at each stage of a campaign.
-
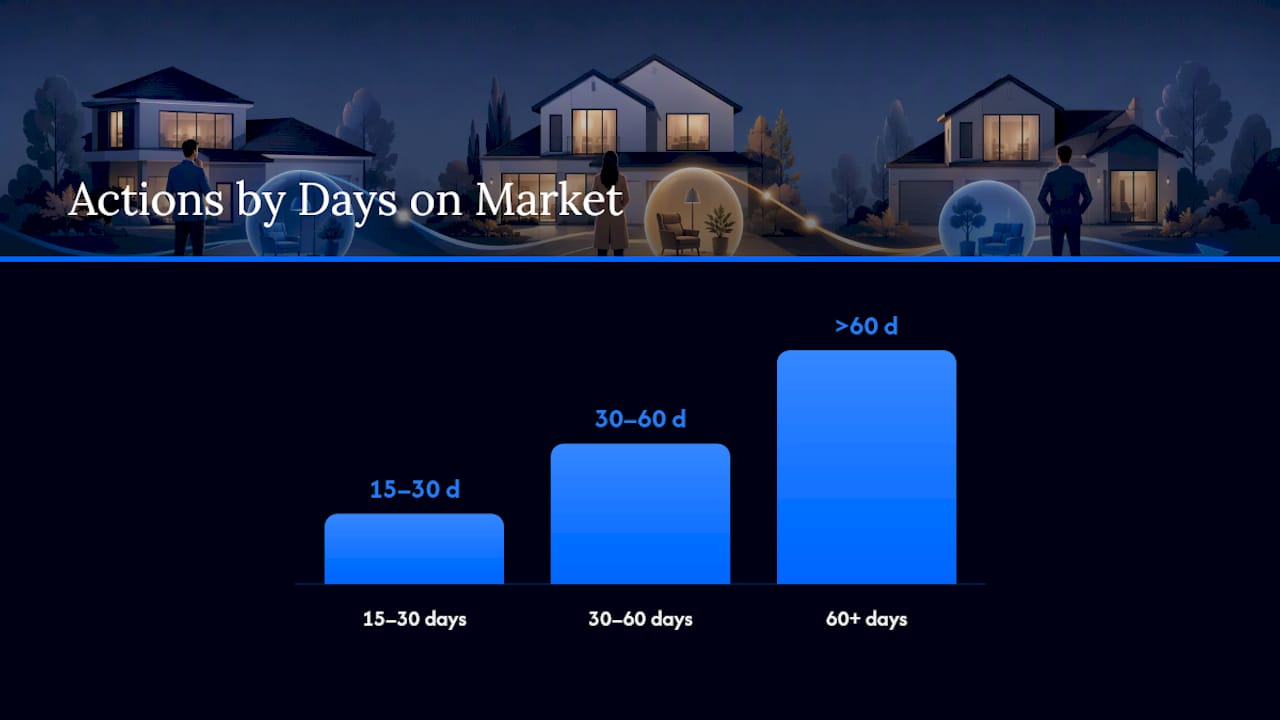
At 15 to 30 days, hold your position. If you’re buying, this is still early enough that vendors expect close-to-asking offers and won’t budge much. If you’re selling and inquiry has been strong, stay the course. If inquiry is weak this early, that’s a signal to revisit pricing before the listing ages further, because a stale listing carries its own stigma once it crosses the local median.
-
At 30 to 60 days, buyers gain room to negotiate on price or settlement terms, particularly once a listing passes the suburb median. Sellers approaching this window without a firm offer should be talking to their agent about a price adjustment now rather than waiting for the 60-day mark, when the listing starts reading as “stuck” to prospective buyers browsing price history.
-
Past 60 days, buyers can reasonably open with an offer meaningfully below asking, especially if comparable sales in the area cleared faster. Sellers at this point often do better resetting the campaign entirely: new photos, an adjusted price, sometimes even a different agent, rather than persisting with the original strategy. Some vendors choose to withdraw and relist to shed the visible DOM count, though buyers who check listing history will usually spot this anyway.
For sellers specifically, three levers shorten a stalling DOM faster than anything else: a price cut that reflects actual buyer feedback rather than a token reduction, updated presentation (new photography alone can revive stalled inquiry), and reviewing whether the agent’s marketing plan actually reached the right buyer pool. Working through a structured decision checklist at each of these checkpoints keeps the response proportional to what the market is actually telling you, instead of panicking or waiting too long.
Investors weighing a flip against a long-term hold should treat DOM differently again. For a short-term flip, a rising local DOM is a warning to delay listing or lower your exit price expectations, because the market has less appetite to absorb your resale on your timeline. For a long-term hold, a temporarily elevated DOM matters far less. What counts is whether the underlying trend across several quarters is improving or worsening, since a single seasonal dip says little about where the suburb sits three years out.
Pro Tip: If you’re selling and considering a price drop, cut once and cut meaningfully rather than trimming in small increments every few weeks. Repeated small cuts read as desperation to buyers watching the price history and often extend DOM rather than shortening it.
Limitations and common mistakes when interpreting days on market
The single biggest misread of DOM is assuming a long campaign means something’s physically wrong with the property. In the overwhelming majority of cases, it means the price and the market disagree, not that there’s a defect buyers are avoiding. Adjusting price or marketing typically shortens a stalled campaign far more reliably than any structural fix would.
A few other traps catch people out regularly:
- Relists and off-market gaps distort the visible number. A property pulled off the market for six weeks and relisted can show a deceptively low DOM that hides months of prior unsuccessful marketing.
- Agent practices vary. Some list at a deliberately ambitious price expecting negotiation; others price to sell fast. Comparing raw DOM across agents without accounting for this skews the read.
- Thin-volume suburbs produce noisy figures. A handful of sales can swing a median DOM by weeks, so treat any suburb report built on a small sample with scepticism.
- Atypical stock behaves differently. Luxury homes, off-the-plan apartments, and vacant land routinely carry naturally longer DOM because their buyer pool is smaller, and comparing them against typical residential benchmarks is misleading.
- DOM isn’t the whole selling timeline. The full process from decision to settlement often runs three to six months once you include preparation, conveyancing and settlement, so a “20-day DOM” sale is still a multi-month undertaking overall.
The fix for all of these is the same: never read DOM in isolation. Cross-reference it against comparable sales, vendor discounting figures, and broader inventory and market cycle context before drawing a conclusion about what’s really happening in a suburb.
How Wealthstacker factors days on market into valuations
Wealthstacker’s automated quarterly valuations pull DOM trends alongside price history, vendor discounting and comparable sales data rather than treating any single metric as the whole story. When a suburb’s median DOM starts falling across consecutive quarters, that shift flows directly into the scenario modelling behind Wealthstacker’s rentvesting and buying comparisons, adjusting forecasted growth assumptions before the change fully shows up in median sale prices.
Here’s a simplified version of what that looks like in practice:
| DOM signal | What it typically suggests | How the modelling responds |
|---|---|---|
| Falling DOM over 2+ quarters | Rising buyer competition, tightening supply | Scenario forecasts lean toward buying sooner or holding existing stock |
| Rising DOM over 2+ quarters | Cooling demand, potential price softening | Rentvesting scenarios get more weight; buy timing gets pushed out |
| Stable DOM near suburb median | Balanced conditions | Standard 15-year projections apply with no urgency adjustment |
This matters most for two groups: people trying to work out their borrowing power and buy-versus-rentvest position in real time, and renters comparing whether continuing to rent while investing elsewhere still stacks up against buying now. Feeding a live, evidence-based signal like DOM into that comparison, rather than relying on last year’s median price alone, gives a clearer read on whether the timing actually favours a move.
Sources
- How to Read a Suburb Report: 9 Data Points That Matter 2026 - HTAG | Data Talks. We translate.
- Members
- Days on Market (DOM) — Which Real Estate Agent
- How long does it take to sell a house? - OpenAgent
Portal DOM figures differ mainly because of how each service handles relists and status changes, so always check listing history before comparing numbers across sites.