Australia property forecast 2026: what buyers and investors need to know
National dwelling prices are set to be flat to slightly negative across 2026, with most economists pointing to a range of roughly minus 1% to modest low single-digit growth by year’s end. Westpac expects combined-capitals price growth to stall on average this year, while KPMG forecasts national house prices to fall around 1.1% before a 2027 rebound. Investor activity is the swing factor, with Westpac projecting a 34% drop in new investor purchases as higher borrowing costs and the May Budget’s tax reforms bite.
Here’s what that means right now:
- Buyers get more negotiating room and less competition at auction, particularly in Sydney and Melbourne.
- Investors face tighter negative gearing rules on established properties and a reworked capital gains tax regime, pushing many toward new builds.
- Renters should brace for continued rental growth, since fewer investors buying doesn’t mean more homes coming onto the rental market.
Key Takeaways
Australia’s 2026 property market is cooling under the combined weight of restrictive monetary policy and Budget tax reform, not collapsing under a structural shock.
| Point | Details |
|---|---|
| National direction | Flat to around -1.1% nationally in 2026, per Westpac and KPMG modelling. |
| Investor pullback drives the number | New investor activity is projected to fall roughly 34%, the single biggest swing factor. |
| Sydney and Melbourne weakest | Both cities face the sharpest softening; Perth and Brisbane are comparatively resilient. |
| Rents keep rising regardless | Rental growth is expected to continue even as capital values soften. |
| Grandfathering limits distress selling | Existing holdings bought before 12 May 2026 are protected, reducing panic-selling risk. |
| Model your own numbers | WealthStacker’s free quarterly valuations and 15-year scenario tools show how the 2026 forecast applies to your specific property or rentvesting decision. |
Table of Contents
- Australia property forecast 2026: the national headline numbers
- How will property prices change in each capital city in 2026?
- What’s driving Australia’s 2026 property market predictions?
- What does the 2026 property outlook mean for buyers and investors?
- Rental market outlook: rents, vacancy and yields in 2026
- What could change the 2026 property forecast?
- Base, downside and upside scenarios for 2026 and 2027
- How WealthStacker models representative 2026 investor scenarios
- Regional property markets outside the capital cities in 2026
- How WealthStacker helps you act on the 2026 forecast
- Frequently asked questions about the 2026 property forecast
- Sources
Australia property forecast 2026: the national headline numbers
The clearest signal in this year’s data is a market that’s cooling, not collapsing. Westpac’s May 2026 housing forecast update puts combined-capital dwelling price growth at roughly flat for the calendar year, with total dwelling turnover down around 20% as buyers and sellers both sit on their hands. KPMG’s August 2026 outlook is slightly more bearish, forecasting a 1.1% national fall in house prices this year before conditions improve in 2027.
Three forces are doing most of the work. The RBA has described monetary policy as somewhat restrictive through 2026, and it’s linked recent cash rate settings directly to softer housing conditions and a pullback in lending. Layered on top of that, the May 2026 Federal Budget restricted negative gearing to newly built dwellings and replaced the 50% capital gains discount with cost base indexation plus a 30% minimum tax on gains. Existing holdings bought before 12 May 2026 are grandfathered, which matters enormously for how this plays out (more on that in the risks section). Finally, credit itself has tightened: the RBA’s Statement on Monetary Policy shows new housing loan commitments have fallen sharply as banks and borrowers both adjust to higher rates.
Statistic callout: Westpac projects a significant fall in new investor activity in the near term, one of the sharpest single drivers behind the flat 2026 growth forecast.
Here’s how the headline figures stack up across the key indicators economists are watching this year.
| Metric | 2026 Forecast | Source |
|---|---|---|
| National dwelling price growth | Roughly flat (Westpac); around -1.1% for houses (KPMG) | Westpac, KPMG |
| New investor activity | Down significantly | Westpac |
| Total dwelling turnover | Down noticeably | Westpac |
| Housing credit growth | Easing, new loan commitments down sharply | RBA |
None of this is locked in. These figures depend on assumptions holding: that the RBA doesn’t tighten further, that the Budget’s tax changes don’t trigger a bigger sell-off than modelled, and that net migration doesn’t swing sharply in either direction. Treasury’s own modelling assumes a gradual transition rather than a shock, which is a reasonable base case but not a guarantee.
How will property prices change in each capital city in 2026?
Averages hide a lot. The national number is really eight quite different stories, and where you’re buying or holding matters more than the headline figure suggests.
- Sydney: Softest of the majors. KPMG names Sydney as one of the weakest-performing capitals for 2026, with high price bases and investor-heavy suburbs feeling the tax changes most acutely.
- Melbourne: Similarly weak. Melbourne has carried an oversupply of apartments and units into this downturn, compounding the effect of reduced investor demand.
- Brisbane: More resilient than the southern capitals, supported by continued interstate migration and comparatively tighter supply, though growth has slowed from the pace of recent years.
- Adelaide: Holding up reasonably well on relative affordability, though turnover has slowed alongside the rest of the country.
- Perth: Among the stronger performers, still benefiting from a structural supply shortfall built up over the past several years.
- Hobart: Smaller market, more volatile month to month, but not facing the same investor exodus pressure as the bigger capitals.
- Canberra: Public-sector employment provides a buffer against the worst of the softening, keeping conditions comparatively stable.
- Darwin: Historically the most cyclical capital; current signals point to relative stability rather than a sharp move either way.
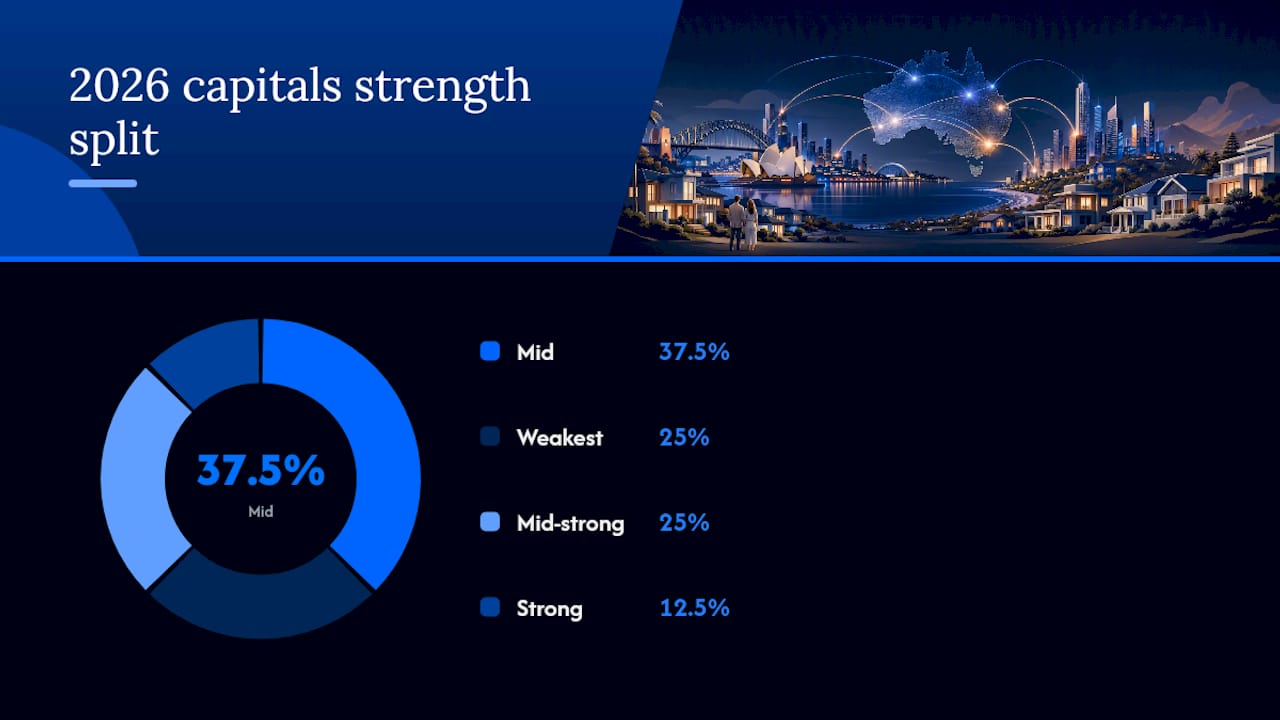
| City | 2026 direction | Relative strength | Primary driver | Rebound timing |
|---|---|---|---|---|
| Sydney | Soft to negative | Weakest | High investor exposure, affordability ceiling | Late 2027 |
| Melbourne | Soft to negative | Weakest | Unit oversupply, investor pullback | Late 2027 |
| Brisbane | Flat to mild growth | Mid-strong | Migration inflow, tighter supply | Mid 2027 |
| Adelaide | Flat | Mid | Relative affordability | Mid to late 2027 |
| Perth | Mild growth | Strong | Structural undersupply | Already stabilising |
| Hobart | Flat, volatile | Mid | Small market base | Uncertain |
| Canberra | Flat | Mid-strong | Stable public-sector employment | Mid 2027 |
| Darwin | Flat | Mid | Cyclical but currently stable | Uncertain |
The pattern is fairly consistent with what’s driven the last few cycles: cities that built enough new supply and kept attracting migrants are weathering the investor pullback better than the two biggest, most expensive markets.
What’s driving Australia’s 2026 property market predictions?
Five forces are pulling in the same direction this year, which is precisely why the softening has been broad rather than confined to one segment of the market.
- RBA cash rate settings. Monetary policy is doing what it’s designed to do: cooling demand by making borrowing more expensive, and the RBA has confirmed that’s the intended effect, not an accident.
- Federal Budget tax reform. Negative gearing restricted to new builds, plus a reworked capital gains tax, changes the maths on holding established property as an investment.
- Investor demand shifting toward new builds. Because negative gearing now only applies to new construction, investor capital is being steered toward off-the-plan and newly built stock rather than existing homes.
- Migration and undersupply. Net migration remains a structural support for demand even as short-term buying activity slows, keeping the long-term supply and demand imbalance largely intact.
- Tighter lending conditions. Banks have pulled back new housing loan commitments in response to the rate environment, squeezing borrowing capacity for both investors and owner-occupiers.
Pro Tip: Don’t treat these drivers as independent. Higher rates and the new CGT regime compound each other: an investor already facing a smaller after-tax return from a rate rise is now also losing the 50% CGT discount on a future sale. That’s two headwinds hitting the same decision, not two separate ones.
Each driver has a different half-life. Rate settings can reverse relatively quickly if the RBA starts cutting; the Budget’s tax architecture is far stickier and will shape investor behaviour for years, particularly given the debt-to-income constraints APRA already places on lending.
What does the 2026 property outlook mean for buyers and investors?
The right move depends entirely on which category you fall into, and treating “the market” as one undifferentiated thing is how people make expensive mistakes in years like this one.
- First-home buyers get the best negotiating conditions in years, especially in Sydney and Melbourne. Use reduced competition to your advantage, and look closely at deposit scheme changes that expand eligibility.
- Owner-occupiers upgrading or downsizing benefit from a more balanced market where both sides of the transaction move at a similar pace, reducing the risk of being caught between selling and buying.
- Long-term buy-and-hold investors should focus on new-build stock to retain negative gearing eligibility, and stress-test any purchase against a flat-to-mild-growth scenario rather than assuming past capital growth rates repeat.
- Short-term flippers face the toughest conditions of any group this year, given reduced turnover and a CGT regime that now penalises quick resale more heavily than before.
- Rentvestors should compare the total return of renting where they live and buying where the numbers work, rather than assuming ownership always beats renting in a softening market.
Pro Tip: Model 15-year outcomes, not 12-month ones. A single flat year barely moves the needle on a long-run compounding return, and reacting to short-term softness is one of the most common ways investors lock in a worse outcome than if they’d simply stayed the course.
Rental market outlook: rents, vacancy and yields in 2026
Fewer investors buying doesn’t translate into more rental stock. Vacancy rates remain historically tight, and rental growth is expected to stay elevated through the rest of 2026 even as capital values soften in several capitals.
Statistic callout: National rental growth is expected to remain elevated for the remainder of 2026, according to market data cited by KPMG, keeping yields firm even where prices are flat or falling.
There’s a geographic wrinkle worth watching. Because the Budget’s tax changes steer investor capital toward new builds, realestate.com.au warns rental supply pressure could intensify in inner and middle-ring suburbs, where established rental stock is concentrated, while new supply lands further out in growth corridors.
What could change the 2026 property forecast?
Every forecast rests on assumptions, and it’s worth knowing which ones carry the most risk of breaking.
- RBA policy surprises. Either an unexpected tightening cycle or an earlier-than-expected round of rate cuts would shift the outlook materially in opposite directions.
- A bigger investor sell-off than modelled. If more investors exit ahead of the CGT changes than Treasury assumed, turnover and price falls could exceed current forecasts.
- A global shock. An energy price spike or banking-sector stress offshore would flow through to Australian credit conditions quickly.
- Migration surprises. A sharp change in net overseas migration, in either direction, would move demand faster than supply can respond.
- Construction and supply failures. Ongoing builder insolvencies or material cost blowouts could choke off the new-build supply the Budget changes are meant to encourage.
The mitigating factor worth remembering: grandfathering protects existing investor holdings bought before 12 May 2026, which reduces the likelihood of a panic-driven wave of distress selling. Combined with a resilient labour market, that makes a sharp, disorderly correction less likely than a slow, uneven cooling.
Base, downside and upside scenarios for 2026 and 2027
Most economists frame 2026 as a correction rather than the start of a structural downturn, but the paths diverge from here.
| Scenario | 2026 outcome | 2027 rebound timing | Main trigger |
|---|---|---|---|
| Base case | Flat to -1% nationally | Gradual recovery from mid-2027 | Rates stabilise, tax changes absorbed gradually |
| Downside | -3% to -5% in Sydney/Melbourne | Delayed into late 2027 | Sharper investor exodus, further rate rises |
| Upside | Flat to modest growth | Earlier recovery, late 2026 | RBA cuts sooner than expected, migration surges |
Westpac describes the current softness as an air pocket rather than a structural break, a short, sharp correction that clears once rate and policy uncertainty settle. Under the base case, hold and selectively buy in resilient cities like Perth or Brisbane; under the downside, defend cash flow and avoid new debt commitments; under the upside, move early before competition returns.
How are these property forecasts actually calculated?
Forecasters lean on a common set of inputs: RBA cash rate and credit data, auction clearance rates, housing turnover figures, and Treasury’s own Budget modelling assumptions. Each institution weights these differently, which is why Westpac and KPMG land on slightly different numbers.
| Data source | What it measures | Why it matters |
|---|---|---|
| RBA statements and SMP | Cash rate, credit growth, lending commitments | Shows monetary transmission into housing demand |
| Treasury Budget modelling | Tax policy impact, owner-occupier share | Explains structural, multi-year shifts |
| Bank economist forecasts | Price growth, turnover, investor activity | Near-term price and volume estimates |
| Property portal data | Listings, clearance rates, buyer demand | Real-time market sentiment |
A few traps to avoid when reading any short-term forecast:
- Don’t treat a single quarter’s data as a trend; auction clearance rates are volatile month to month.
- Remember that national averages mask sharp differences between cities and even between suburbs within the same city.
- Be wary of forecasts that don’t disclose their assumptions about interest rates or migration; the assumptions do most of the work in the final number.
How WealthStacker models representative 2026 investor scenarios
Reading a national forecast is one thing; working out what it means for your own numbers is another. WealthStacker runs automated quarterly valuations and 15-year scenario modelling that lets you see how a conservative, base, or aggressive assumption set plays out for a specific property or rentvesting comparison, rather than relying on a national average that may not apply to your suburb.
| Scenario | 2026 modelled outcome | 2027 modelled outcome |
|---|---|---|
| Conservative | Flat portfolio value | Low single-digit growth resumes |
| Base case | Slight softening, in line with Westpac’s flat forecast | Gradual recovery aligned with KPMG’s 2027 rebound view |
| Aggressive (new-build focus) | Modest growth from targeted new-build exposure | Stronger growth as CGT and gearing settings favour new stock |
Statistic callout: Under WealthStacker’s base-case model, a representative portfolio tracks the same flat-to-mild trajectory Westpac projects nationally, then resumes growth in step with the 2027 rebound most economists expect.
Regional property markets outside the capital cities in 2026
Regional Australia isn’t experiencing the same investor pullback as the capitals, largely because regional buyers have always skewed more heavily toward owner-occupiers than investors. That structural difference is cushioning many regional markets from the sharpest edges of the Budget’s tax changes.

Lifestyle and coastal regions that boomed through the pandemic years have already worked through much of their price correction, and several are now tracking closer to historical growth rates than the still-adjusting capitals. Regional centres tied to mining, agriculture, or major infrastructure projects tend to follow local employment conditions more than national rate settings, which is why a town in regional Western Australia can look completely different to one in regional Victoria in the same forecast year.
Affordability remains the biggest draw. With capital city entry prices still elevated relative to income even after a soft year, regional markets within commuting distance of major employment hubs continue to attract first-home buyers and remote workers alike. Supply constraints matter here too. Many regional council areas approve new dwellings more slowly than growth in demand, which keeps a floor under prices even when capital city momentum stalls. For investors weighing a rentvesting strategy against buying where they live, regional markets with strong rental yields and lower entry prices are worth comparing directly against capital city alternatives rather than dismissing on the assumption that capitals always outperform.
How WealthStacker helps you act on the 2026 forecast
Knowing the national number is flat and Sydney’s softer than Perth doesn’t tell you what to do with your own deposit or existing portfolio. WealthStacker turns the forecast into a decision by running your actual numbers against the same scenarios covered above.
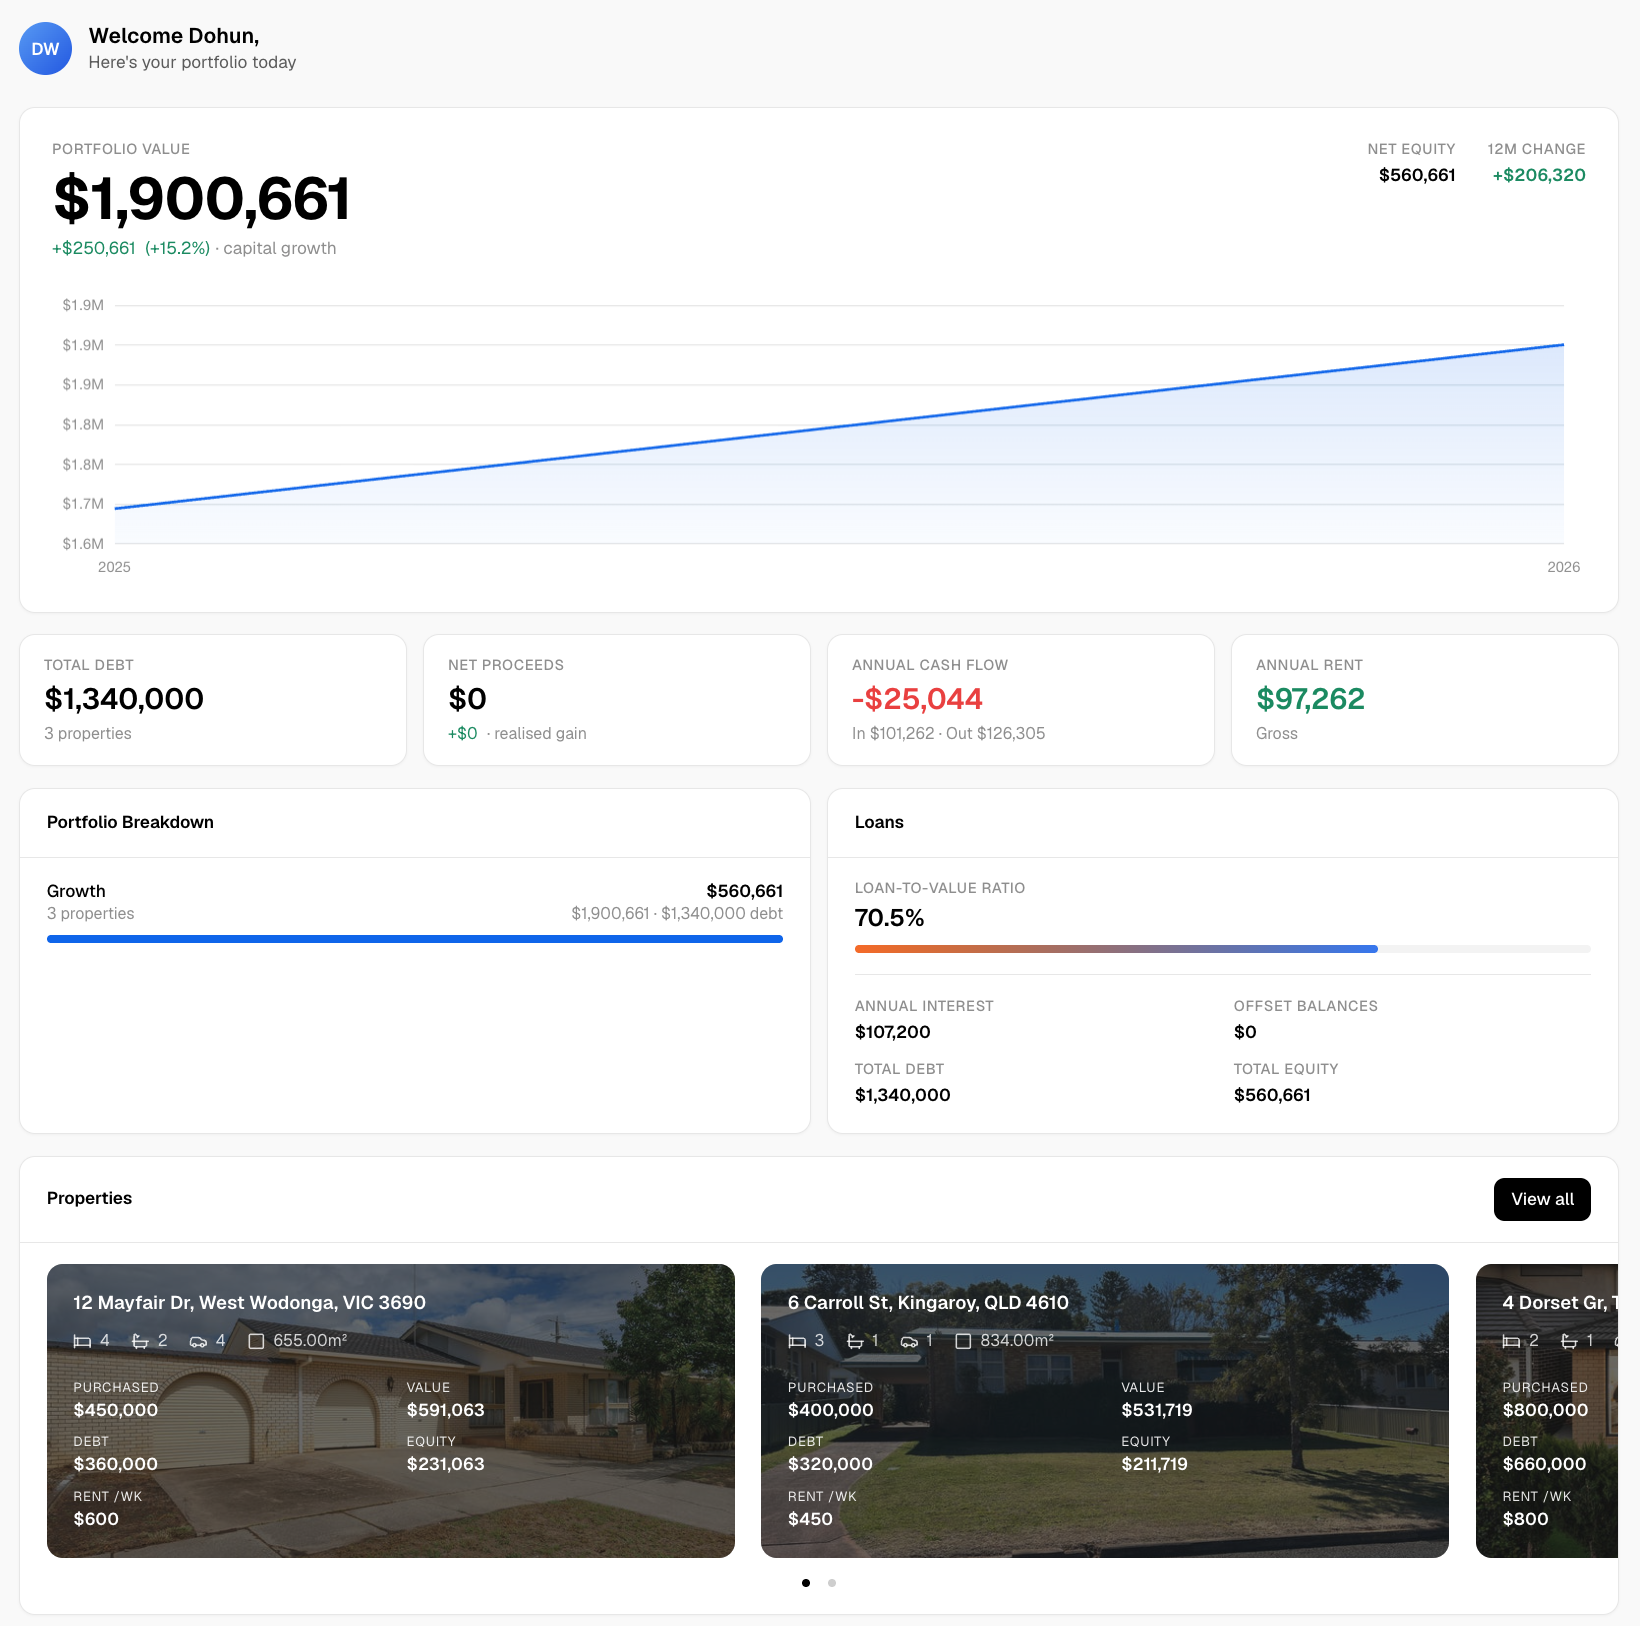
Three ways it helps directly:
- Compare rentvesting against buying using 15-year modelling that accounts for the new gearing and CGT settings, not last year’s tax rules.
- Get free automated quarterly valuations so you can track how your property or shortlist is actually performing against the forecast, updated every quarter without manual work.
- Check borrowing power and suburb risk overlays before you commit, factoring in the tighter lending conditions the RBA has flagged this year.
If you’re weighing whether 2026’s softer conditions are a buying window or a reason to wait, run your own numbers through WealthStacker’s property investment toolkit and see how a conservative, base, or aggressive scenario actually plays out for your situation before you make a decision either way.
Frequently asked questions about the 2026 property forecast
Will property prices fall in Australia in 2026? Most forecasts point to a flat to mildly negative year nationally, with KPMG projecting around a 1.1% fall in house prices and Westpac expecting growth to stall across the combined capitals rather than a sharp decline.
Which capital city will perform worst in 2026? Sydney and Melbourne are widely flagged as the weakest capitals this year, largely due to higher investor exposure and, in Melbourne’s case, an oversupply of units still working through the market.
Should I buy property now or wait until 2027? It depends on your goals. Buyers get better negotiating conditions in 2026, but if you’re an investor relying on negative gearing for an established property, the new rules limiting that benefit to new builds are worth factoring into your decision before you commit.
How will the Federal Budget’s tax changes affect property investors? Negative gearing now applies only to newly built dwellings, and the 50% CGT discount has been replaced with cost base indexation plus a 30% minimum tax, though holdings bought before 12 May 2026 are grandfathered under the old rules.
Will rents keep rising even if house prices fall? Yes.
This article is general information, not a substitute for advice from a qualified financial advisor. Consult a qualified financial professional about your own circumstances before acting on anything here.
Sources
- Housing forecast update | Westpac IQ
- Tax explainers — Negative gearing & capital gains tax | Commonwealth Budget 2026 factsheet
- The restrictive stance of monetary policy | RBA speech (13 August 2026)
- Property market fundamentals remain solid post-Budget | realestate.com.au (May 2026)
- Rising rates and growing uncertainty continues to cool housing market | KPMG (Aug 2026)