
Australian Property Forecast for 15 Years: Three Scenarios, Wider Gaps
A realistic 15 year property forecast for most markets sits somewhere between 3% and 7% pa nominal capital growth, with the actual outcome depending heavily on the assumptions you feed into the model. Recent data from the Australian Bureau of Statistics shows how quickly conditions can shift even over a single quarter, which is why we walk through the methods, the key drivers and three worked scenarios below so you can build a forecast suited to your own situation.
TL;DR:
- A nominal 5% annual return becomes about 2% to 2.5% after 2.5% to 3% inflation, so separate real growth from price appreciation.
- Test your base case against a 1% to 2% rate rise and prolonged vacancy, and keep several months of repayments in cash reserves.
- Calculate returns on proceeds after taxes and selling costs, while including purchase fees, maintenance, vacancy, management, and loan servicing.
- Refresh each scenario quarterly with updated local prices, rents, and rate assumptions; national averages can hide sharply different outcomes across cities and regions.
Wealthstackerwealthstacker.com.auModel Your Property Investment OutlookCompare property strategies with personalized modeling and automated quarterly valuations to keep your real estate decisions informed.Explore WealthStacker
Table of Contents
- Practical forecasting methods for a 15 year horizon
- Which economic and market drivers change 15 year forecasts most
- Three 15 year worked scenarios with numeric results
- How to interpret your forecast and turn it into decisions
- Include transaction and tax costs in your 15 year model
- Step-by-step checklist and tool choices to produce your 15 year forecast
- How WealthStacker automates 15 year forecasts and helps you keep them current
- FAQ
- Sources
Practical forecasting methods for a 15 year horizon
Three approaches cover most of what you need: compound annual growth rate (CAGR), inflation-adjusted modelling and scenario-based forecasting. Each answers a slightly different question, and combining them gives a fuller picture than relying on one alone.
CAGR tells you the annualised growth rate needed to get from a starting value to an end value over a set period. The formula is (end value divided by start value) raised to the power of (1 divided by number of years), minus 1. A property worth $650,000 today that reaches $1,350,000 in 15 years has grown at a CAGR of roughly 5%. That single number smooths out the bumps along the way, which is useful for comparison but hides the volatility a buyer actually experiences.
Inflation-adjusted projections strip out the effect of rising prices generally, showing whether a property is building real wealth or simply tracking the cost of living. A nominal 5% pa return looks very different once you subtract an inflation rate of 2.5% to 3%, leaving a real return closer to 2% to 2.5%.
Scenario-based modelling runs several plausible futures side by side rather than betting on one number. A typical setup uses:
- A base case built on long-run averages for growth, rent and costs.
- An upside case assuming stronger wage growth, tighter supply or lower rates.
- A downside case assuming rate rises, oversupply or weaker population growth.
Sensitivity testing then shows how much the end result moves when you nudge one assumption, which matters more than picking the “right” number. For a quick check, a calculator is fine; for anything you plan to act on, a simple spreadsheet or a dedicated modelling tool gives you more control over the assumptions.
Which economic and market drivers change 15 year forecasts most
Some inputs move the needle far more than others over a 15 year horizon, so it pays to spend your time getting these right rather than fine-tuning minor details.
- Interest rates and servicing costs: the cash rate path set by the Reserve Bank of Australia directly affects borrowing capacity and, in turn, what buyers can pay.
- Wage and household income growth: demand for housing tracks how much more buyers can borrow and service over time, not just population numbers alone.
- Supply-side factors: dwelling completions, planning approval timeframes and population growth together determine whether a market stays tight or loosens.
- Rental yield and vacancy rates: these shape your net return independently of capital growth, especially for an investment property carrying debt.
- Policy and tax settings: changes to capital gains tax treatment, stamp duty concessions or lending rules can shift investor behaviour structurally rather than cyclically.
The RBA’s 2026 outlook notes housing price falls in many capital cities alongside near-term uncertainty, a reminder that national averages can mask very different conditions across cities and regions. A forecast that ignores the local supply and demand picture in favour of a single national growth rate will tend to be wrong in both directions at once.
Three 15 year worked scenarios with numeric results
Starting with a $650,000 property, here is how three different sets of assumptions play out over 15 years. Each scenario assumes a gross rental yield, a vacancy allowance and holding costs, then compounds the nominal growth rate annually.
- Cautious scenario: 3% pa nominal growth, 3% inflation, 3.5% gross yield, 5% vacancy allowance. End value: approximately $1,012,000. CAGR: 3% pa. Real growth after inflation is close to flat.
- Base scenario: 5% pa nominal growth, 2.8% inflation, 4% gross yield, 4% vacancy allowance. End value: approximately $1,351,000. CAGR: 5% pa. Real growth sits around 2.1% to 2.2% pa.
- Optimistic scenario: 7% pa nominal growth, 2.5% inflation, 4.5% gross yield, 3% vacancy allowance. End value: approximately $1,793,000. CAGR: 7% pa. Real growth lands near 4.4% pa.
The gap between these scenarios is the point, not the individual numbers. Moving the growth assumption by just 1% pa, from 5% to 6%, changes the 15 year end value by more than $125,000 on a $650,000 start, which shows how much a seemingly small assumption shift compounds over a long period. Small differences in assumed annual growth compound significantly over 15 years, and even a modest gap in the assumed rate can change the end value by tens of percent.
These figures are illustrative only, built from the assumptions above rather than drawn from any market data series.
Pro Tip: Re-run your three scenarios every quarter using updated price, rate and rental data so your model reflects current conditions rather than assumptions made years earlier.
Tools like WealthStacker automate this kind of scenario testing with quarterly re-valuations, which removes the manual work of updating each input by hand.

How to interpret your forecast and turn it into decisions
A forecast is only useful once it changes what you do, so treat the output as a decision tool rather than a prediction to file away.
- Stress-test your base case against a 1% to 2% rate rise and a prolonged vacancy period to see whether servicing still holds up.
- Build a buffer of several months’ repayments into your cash flow plan rather than assuming rental income covers costs every month.
- Use the gap between your cautious and optimistic scenarios to set a realistic selling or refinancing window rather than a single target date.
- Reconsider a rentvesting approach if your forecast shows weak net yield in your target suburb compared with where you currently rent.
- Revisit your numbers quarterly so a change in rates or local supply shows up in your plan before it affects your finances.
Moneysmart warns that property investing carries real risk, including the chance a property’s value falls below the outstanding loan balance, which is exactly the kind of downside your cautious scenario should account for.
Pro Tip: Set a calendar reminder each quarter to re-check your assumptions against updated ABS and RBA figures, rather than waiting until a rate change forces the review.
If you are weighing whether to hold or sell based on your forecast, a structured net cash test gives you a clearer decision framework than gut feel alone.
Include transaction and tax costs in your 15 year model
Many DIY forecasts skip the costs that eat into net returns, which overstates the final figure. Building these in from the start gives you a number you can actually rely on.
- Upfront transaction costs: stamp duty, legal fees and loan establishment costs typically run to several percent of the purchase price, varying by state and loan size.
- Ongoing holding costs: council rates, insurance, maintenance and property management fees reduce net rental income each year.
- Vacancy-related costs: periods without a tenant mean lost rent plus continued loan servicing, which your model should allow for explicitly.
- Capital gains tax on sale: under ATO rules, selling an investment property acquired after 20 September 1985 generally triggers CGT on the profit, and holding the asset for at least 12 months may entitle an individual to a 50% CGT discount.
- Selling costs: agent commission and marketing typically reduce your net proceeds by a further percentage at the point of sale.
Folding these into your model means calculating CAGR on net proceeds after tax and selling costs, not on the raw end value. Moneysmart’s guidance on borrowing to invest points out that leaving taxes and selling costs out of a forecast is one of the most common ways investors end up with an overly optimistic view of their net return.
Step-by-step checklist and tool choices to produce your 15 year forecast
Producing a usable forecast does not need to be complicated, but it does need a consistent process you can repeat.
- Pull historical price data for your target area from ABS housing statistics alongside recent local sales data.
- Choose your growth, yield and vacancy assumptions for a base, upside and downside scenario.
- Add transaction costs, holding costs and CGT to get a realistic net figure rather than a gross one.
- Factor in servicing costs under at least one higher-rate scenario to check affordability under stress.
- Re-test the whole model quarterly, updating assumptions as new rate, price and rental data comes through.
- Speak with a financial adviser or mortgage broker before committing to a strategy based on the numbers, particularly if you are weighing an SMSF structure or a complex loan arrangement.
If you are sourcing a property manager to help estimate realistic vacancy and management costs, guidance on finding property managers is a useful starting point for that part of your assumptions.
How WealthStacker automates 15 year forecasts and helps you keep them current
Running three scenarios by hand every quarter is tedious, and that is exactly the gap we built WealthStacker to close. Our toolkit provides free automated quarterly property valuations alongside personalised 15 year modelling that compares rentvesting against buying, so you can see how small assumption changes play out without rebuilding a spreadsheet each time.
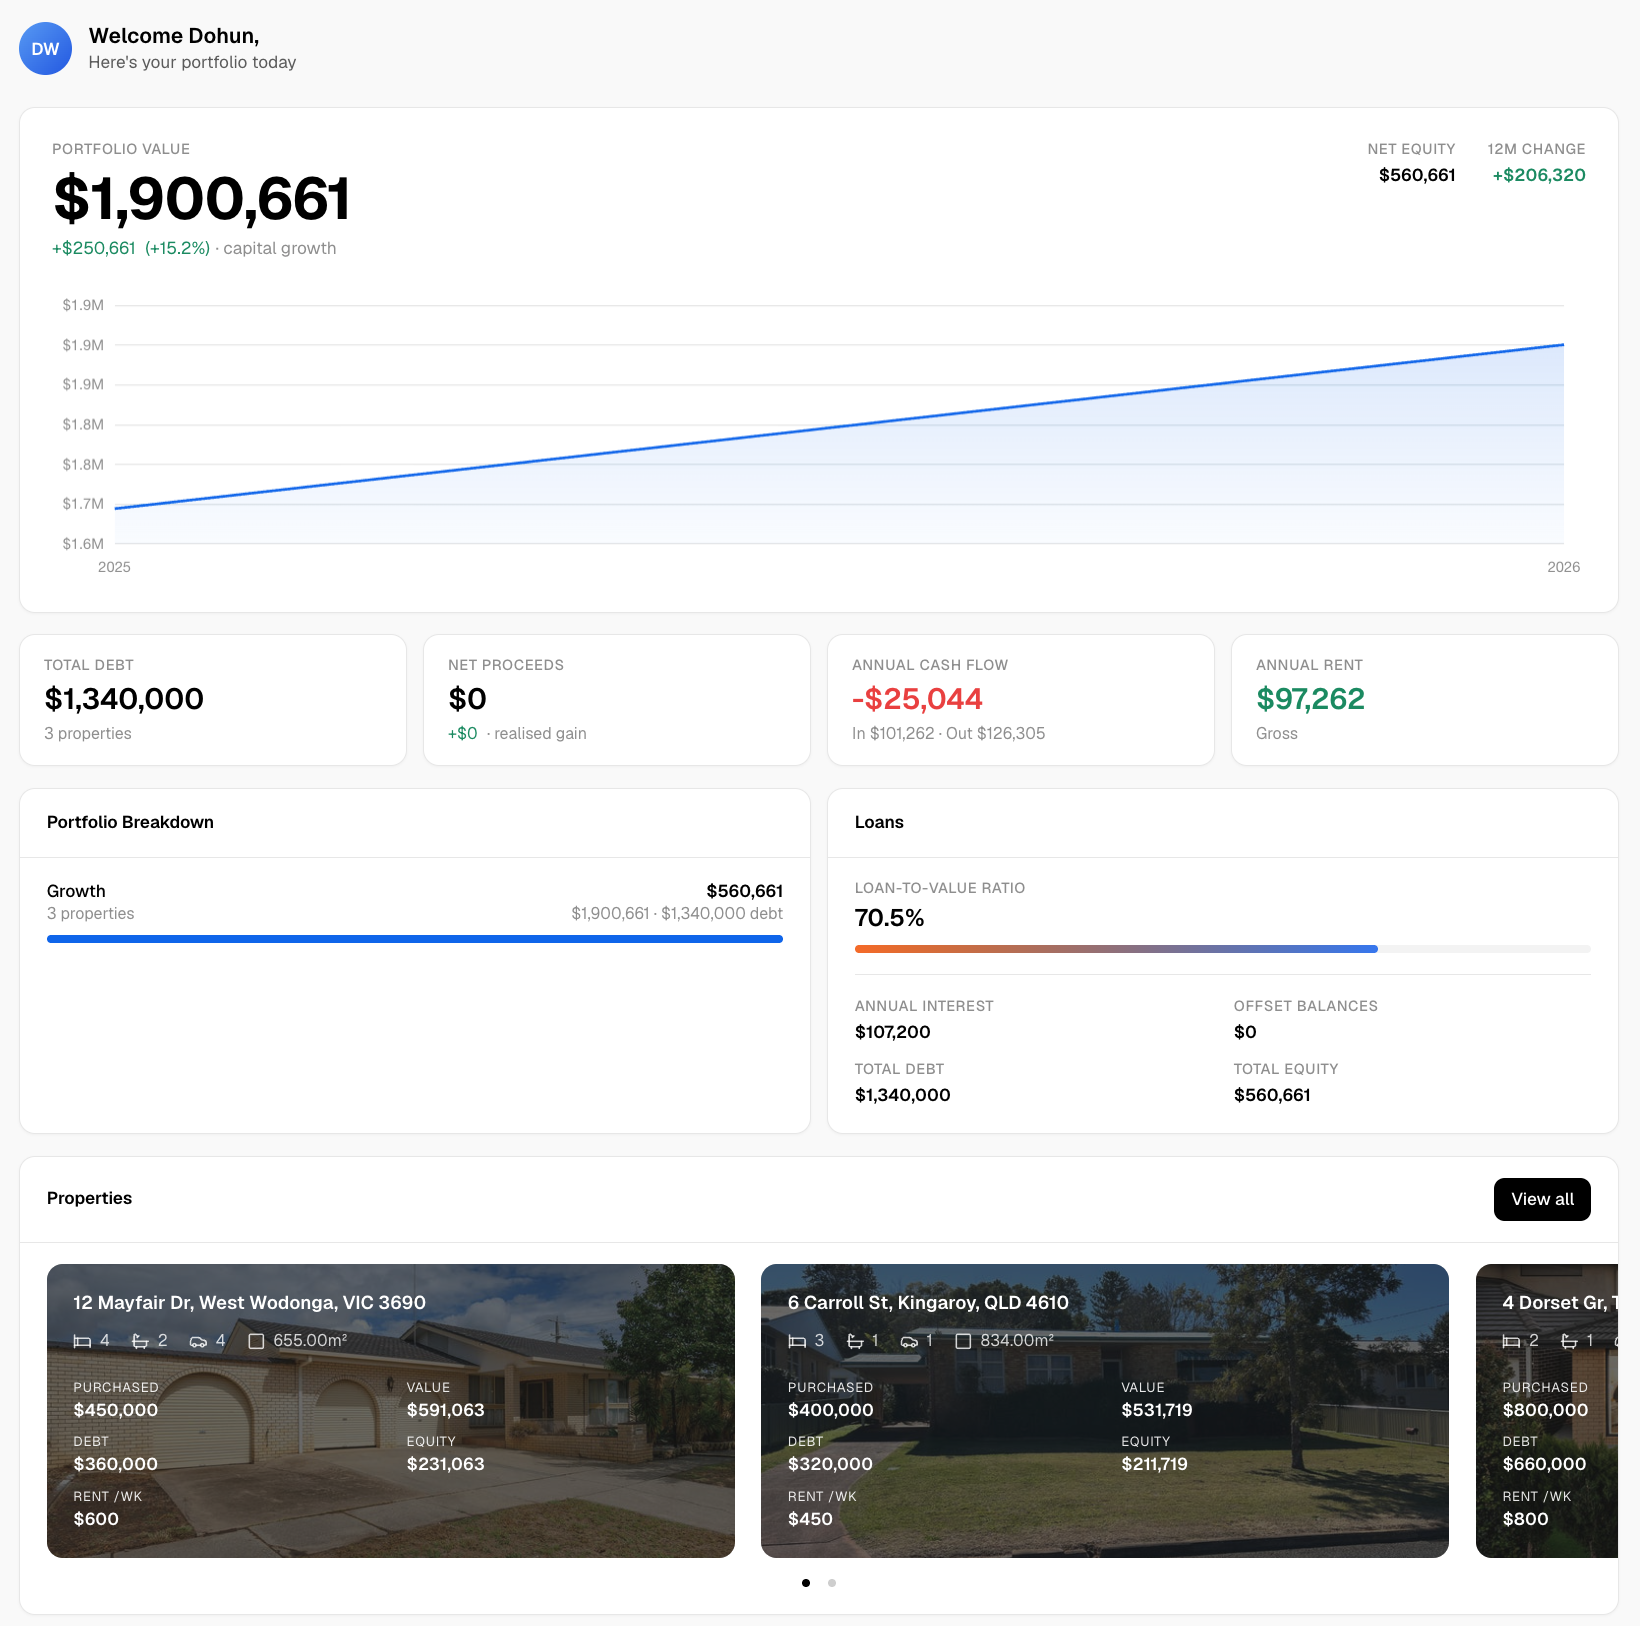
We sync your property, shares and crypto in one dashboard and run sensitivity checks on your borrowing power, which means your forecast stays current as rates and local conditions shift rather than going stale the week after you build it. If you want a forecast that updates itself instead of one you have to remember to redo, you can sign up with WealthStacker and start from your own numbers.
This article is general information, not a substitute for advice from a qualified financial advisor. Consult a qualified financial professional about your own circumstances before acting on anything here.

FAQ
How have house prices declined in Melbourne?
National dwelling values fell 0.3% in the June quarter 2026, with the ABS reporting a 0.7% drop in the national mean dwelling price to $1.1 million. City-level movements vary, and a national figure should not be read as the exact figure for any one capital city.
How much income do you need to buy a $650,000 house?
The income required depends on your deposit size, other debts, interest rate and the lender’s serviceability rules at the time you apply. Moneysmart’s guidance on borrowing to invest recommends checking your borrowing power and building in a buffer for rate rises before settling on a target purchase price.
Is $400,000 enough to build a house?
Build costs vary widely by location, land cost, size and finish level, so the available budget may be enough in some regions and well short in others. Getting a local quote and checking current construction costs in your target area is the only reliable way to answer this for your situation.
Will 2026 be a good time to sell?
Whether 2026 suits a sale depends on your own holding costs, loan servicing position and the outlook for your specific suburb rather than a single national answer. Running a structured sell-or-hold test against your updated forecast gives a clearer answer than timing the market on sentiment alone.
Sources
Building a 15 year forecast you can trust means going back to primary data rather than relying on secondhand summaries. The ABS dwelling value release and its ongoing statistics series are the starting point for national price trends, while the RBA’s monetary policy statements and economic outlook publications give you the cash-rate assumptions your scenarios depend on.
For tax treatment, the ATO’s capital gains tax guidance sets out the rules on the 50% discount and what counts as a taxable event when you sell. Moneysmart’s borrowing to invest guide covers the risk side of the equation, including liquidity and servicing buffers, and its SMSF and property guide is worth reading if you are considering a self-managed super structure. For regional context beyond the national figures, AHURI’s research on investor behaviour and REIQ’s quarterly market commentary both illustrate how much outcomes can diverge between locations.
If your 15 year plan involves structuring your estate or naming beneficiaries for property assets, a guide to executor fees and will structuring is a useful companion resource.
- ABS media release: total value of dwellings falls 0.3%
- ATO – Capital gains tax
- Moneysmart – Borrowing to invest